Datasets
Think of this process in two steps:
- Dataset Configurations: Set the rules for how you want to collect your data.
- Datasets: The actual collection of data gathered based on those rules, ready for training.
Create a dataset configuration
A Dataset configuration tells the system exactly what Zabbix data to gather so your AI learns from the most relevant information.
To create a new configuration:
- Navigate to AI > Datasets.
- Click the + (plus) button in the bottom-right corner.
Prisma only extracts data from Zabbix items tagged with prisma-ai. Ensure you have manually added this tag to your desired items in Zabbix before proceeding.
Step 1: General
- Name: Enter a unique name for this configuration.
- Prisma user group: Select a Prisma user group. A user group is required so the service user can provide access to data on the Zabbix server.
Step 2: Data collection
- Hosts: Select the hosts to pull data from. The count in parentheses shows how many prisma-ai tagged items were found on that host.
- Extraction schedule: Choose how often the system should automatically extract new data (Monthly, Quarterly, Yearly, or Manual).
- Data period: Select the time span to include in each extraction (e.g., 90 days or a Custom range).
Step 3: Storage duration
To prevent your storage from filling up with old training data, define your retention rules:
- Storage duration mode: Choose Unlimited to keep datasets indefinitely or Limited duration to automatically delete them after a specific number of days.
Click Create dataset config to create your new dataset configuration.
Managing your configuration
To view or configure your configurations, click on any dataset configuration entry in the list. The configuration details page is split into the following sections:
General
Review or update the Name and Description of your dataset configuration.
Dataset configuration
Review your selected Hosts, Extraction schedule, and Data period.
Storage options
Review or adjust your Storage duration mode settings
Datasets
This section displays a list of all datasets already created by this configuration and allows you to extract data on demand.
To extract a new dataset on demand, click on Extract data. This opens a modal to provide a name and description. Click Create to finish.
To review the health and details of any specific extraction, simply click its entry in the list.
Dataset details
To inspect a dataset, navigate to AI > Dataset. Select the config which contains the dataset. Created datasets are listed at the bottom of the page. Click the dataset to open its details.
Understand your dataset quality
Not all data is suitable for training AI. A dataset with too many gaps or missing information can confuse the model. We provide a dataset score to help you decide if the data is good enough to use.
The dataset score
You will see a score between 0 and 100.
- 100: Excellent quality. The data is perfect for training.
- 0: Unusable. The data has too many issues to train a model.
- High score: Indicates a reliable dataset for building accurate anomaly detection.
Timeframes and gaps
To ensure accuracy, the AI needs data from all your selected items to line up perfectly. You will notice two important times in your dataset details:
- Configured start/end time: The range you selected in your configuration (e.g., March 1st to March 31st).
- Effective start time: The actual moment when every item in your dataset started reporting data.
If one item started reporting later than the others, any data from the other items before that time is marked as Unusable. The AI skips these points to ensure it learns from complete sets of information.
Unavailable data points
If your data is expected to update regularly (for example, every 1 minute), the system checks for gaps.
- Unavailable: A data point that was expected at a regular interval but is missing.
Too many Unavailable or Unusable data points will lower your dataset score.
Item data health
To ensure each specific item has enough reliable data for the AI to learn from, you can review the detailed breakdown for every individual item in your dataset.
Outages
To help you understand the impact of missing data, the system categorizes gaps into two types:
- Minor outages: These are short, brief gaps. In a healthy dataset, you might see a few of these without it affecting your training results.
- Major outages: These are larger, more significant gaps. Because the AI needs a continuous flow to understand what “normal” looks like, major outages will lower your dataset score.
Value density graph
This graph acts as a visual timeline of your data collection from start to finish.
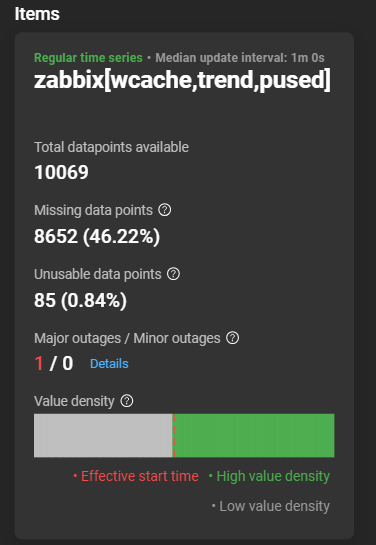
- The horizontal layout: The left side of the block represents the beginning of your requested timeframe, and the right side represents the end.
- Green bars: These indicate high value density. The more solid and bright the green appears, the more consistent your data was during that period.
- Grey gaps: These indicate low value density. A grey vertical slice means data was missing at that specific point in time.
- The red vertical line: This marks the effective start time. If an item didn’t start reporting data immediately, you will see a red line. All data to the left of this line is considered unusable.
If your score is above 0, your dataset is ready to be used for AI model training.