Items
Item list
Items are displayed in a list of item cards, providing information about the item:
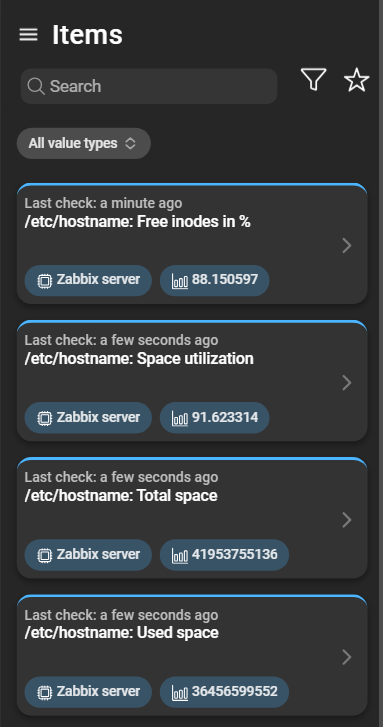
- Timestamp: The timestamp in the card header shows when the item’s data was last checked.
- Item name: The name of the item displayed in the card body.
- Host name: The name of the host on which the item is configured.
- Last data value: The last data value collected by the item, shown as a chip in the card body.
Filtering items
Various filters or favorites can be applied to focus on items matching specific criteria.
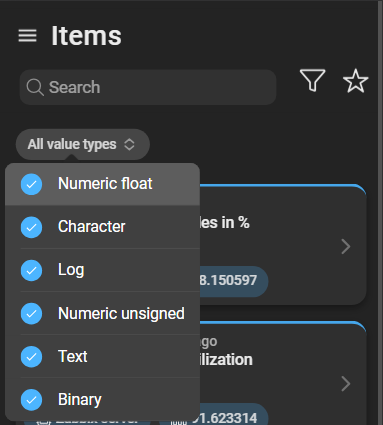
Value types filter
This filter narrows the list of displayed items to those of the selected value types. Each value type corresponds to a category of data an item can collect. Enabling a value type shows items that collect data of that type, while disabling a value type hides these items from the list.
Advanced filters
Clicking the funnel icon opens a menu with advanced filtering and sorting options:
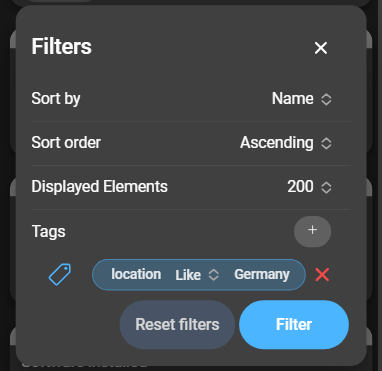
- Sort by: Identifier by which the items are ordered.
- Sort order: Whether the items are sorted in ascending or descending order.
- Displayed elements: Total number of items shown in the list.
- Tags: Filter by tags. Can be expanded by clicking the plus. The tag filter configuration mirrors that of Zabbix.
Click Filter to save and apply filter options. Use Reset Filters to restore the defaults.
Item details
Clicking the arrow on the item card opens the item details:
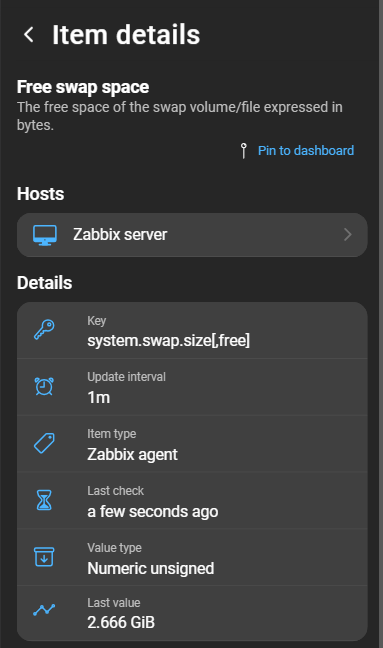
- Item name: The name of the item.
- Pin to dashboard: Option to pin the item to the dashboard for quick access and information.
- Host: The host to which the item is assigned.
- Key: The unique identifier for the item.
- Delay: The update interval of the item.
- Item type: Indicates the type of item, such as
Zabbix agent,Zabbix trapper, orSimple check. - Last check: The timestamp of the item’s last check.
- Value type: Specifies the type of information the item collects, such as
numeric float,character, or other data types. - Unit: The unit of the item configured in Zabbix.
- Last value: The most recent data collected by the item.
Item values
This section provides a way to visualize and explore the collected data. It offers two types of visualization: Graph and List. The display depends on the type of data the item collects. Numeric data is visualized in a graph, while non-numeric data is presented in a list.
Graphs
Prisma offers two types of graphs:
- Item graphs: Found in item details. Generated by Prisma and based on historical
numeric floatandnumeric unsigneditem data. - Zabbix graphs: Found on the graphs page in Prisma. Retrieve and display existing graphs of the Zabbix server.
Graphs generated by Prisma provide the following options while checking item data:
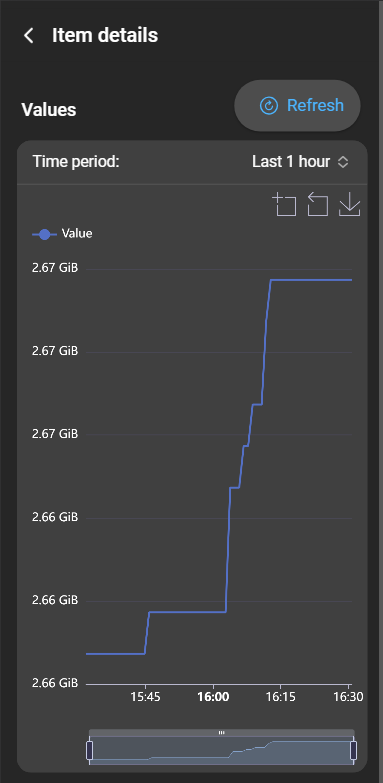
- Refresh: Manually refresh and update the graph with the latest monitored values.
- Time period: Configure and specify a time range. The graph displays data within that range.
- General graph actions: Options for zooming, resetting the zoom, and saving the graph as an image.
- Data zoom: A specific time frame on the graph. The graph zooms in on the selected time frame.
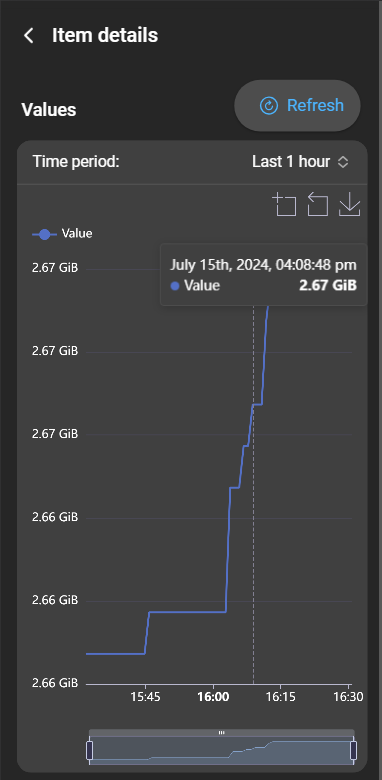
Tapping (or hovering over) a data point in the graph displays an info box with additional details about that point.
List
Displays a range of data values within a specified time frame for item types character, log, and text.
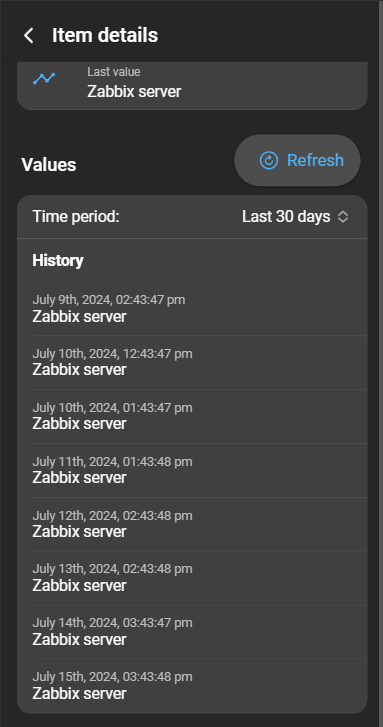
- Refresh: Manually refresh the list to get the latest data values.
- Time period: Select a specific time range. The list displays data within that period.