Getting started
This guide lists the necessary steps to create reports and manage alerts and maintenances in Prisma.
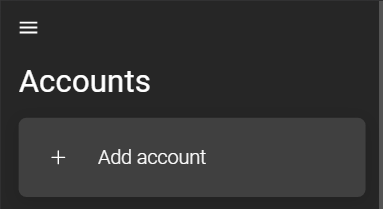
1. Adding an account
Logging into Prisma requires adding an account.
The differences between the IntelliTrend Mobile app and the web app are described in chapter accounts.
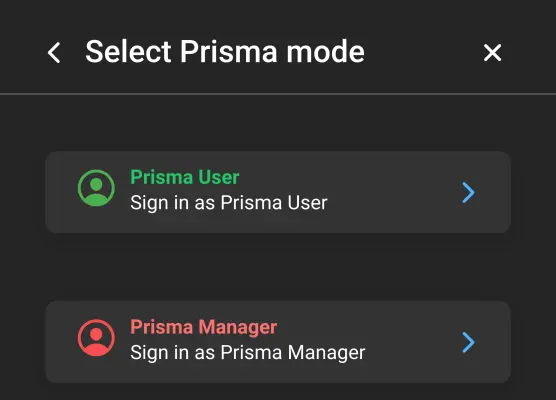
Choose between logging in as a Prisma user or a Prisma manager. A Prisma user is an imported Zabbix user with access to various Prisma sections including the Zabbix Client, Self Provisioning, and Reporting, excluding administrative permissions.
Importing Zabbix users into Prisma is performed by Prisma managers. For login issues with Zabbix credentials, contact a Prisma manager.
Choose Prisma User:
Default Prisma Server
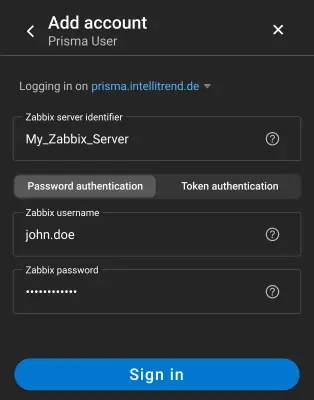
- Zabbix server identifier: The Zabbix server identifier of the server from which the Prisma user originated.
- Password/Token authentication: Toggle between authentication methods. Password authentication is selected by default. More about the topic in chapter Zabbix API token login.
- Username: Designated username.
- Password: Designated password.
Custom Prisma Server
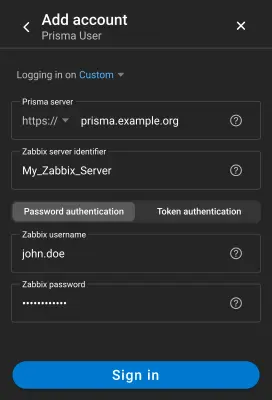
- Prisma Server: The URL of the Prisma Server without
https://orhttp://. The protocol is selected via the dropdown. - Zabbix server identifier: The identifier of the Zabbix server from which the Prisma user originated.
- Password/Token authentication: Toggle between authentication methods. Password authentication is selected by default. More about the topic in Zabbix API token login.
- Username: Designated username.
- Password: Designated password.
- API guard token: If using the API Guard software from IntelliTrend, a token can be provided to add an extra layer of security.
2. Checking available data with the Zabbix Client
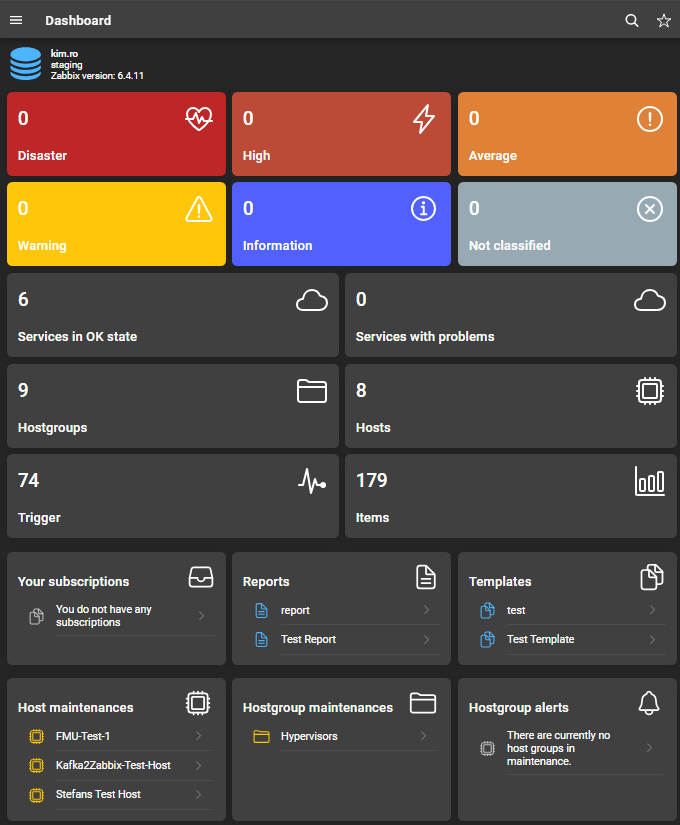
The first page after logging in is the dashboard, which offers an overview about the Zabbix server. This overview includes the user name, server alias and version, as well as information about problems, services, hosts, host groups, triggers, items, maintenances and alerts. More about these sections can be found in the user manual.
When using IntelliTrend Mobile for Zabbix, additional information regarding push notifications is displayed just below the server details. If push notifications are not yet enabled, a note will be displayed, offering access to the push notification settings. Otherwise, if push notifications are enabled, the two most recent, unread push notifications are displayed in this section.
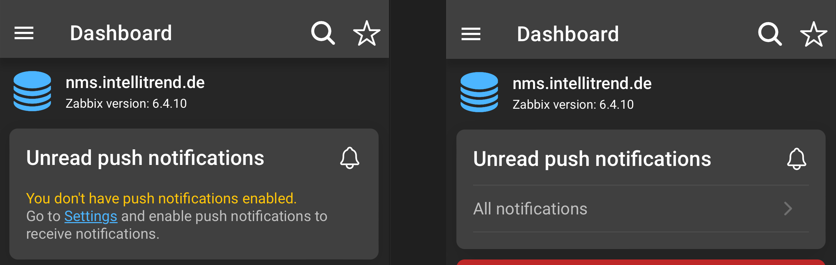
Enabling and configuring push notifications is described in chapter Push notifications.
From this point, the app can be navigated using either the cards or the side-menu to explore other pages. When using the cards to navigate to specific sections, the relevant filters will be applied automatically.
Detailed information about the dashboard can be found here.
3. Creating reports
Requires the user to have a sufficient user role and to be a part of a Prisma user group as mentioned in the Manager manual - Prisma user groups.
Prisma Reporting can be used to generate reports using data from Zabbix servers. Reports are configured by adding widgets to define which data to include and how to process and present it. The following steps describe how to create a report:
- Navigate to Reporting > Reports and click the blue plus icon.
- Define a name for the report, assign a Prisma user group and click create.
- Click on the report to open its configuration.
- Select a reporting schedule to define the data collection period and delivery interval.
- Scroll down to the Widgets section, select the desired widgets and confirm with Add widgets.
- Clicking an added widget opens its configuration. Detailed information about each widget can be found in the widget documentation.
- After configuring the widgets, navigate to Rendered reports and click Render report.
- Select a reporting period and the formats in which the report-files will be generated.
- Click Render now to start report generation and subsequently download the report via the download button.
The report settings offer a wide range of customization options, such as limiting for text items and problems, displaying a table of contents, adding JSON transformers and many more. Available options and detailed information can be found in the report documentation.
Prisma is capable of periodically rendering and sending out reports. To use this feature, users need at least one configured user medium.
4.1 Creating user media
The delivery of reports depends on the configuration of user media. Prisma provides three base media types: Email, SCP, and Kafka. These have to be created and configured by Prisma managers. Once at least one base media type has been configured, user media can be created to receive reports through a preferred channel.
Creating the user medium Email:
- Navigate to Your profile > Settings > User media and click Create user media.
- Provide a name, select Email as media type and provide your Email address.
- Click Create to finish the process.
For detailed information about the all user media and its configuration consult the user media chapter. Consult the chapter User media for detailed information about all types of user media and the respective configuration.
4.2 Subscribe to a report
Requires the user to be a part of a Prisma user group as mentioned in user groups.
While rendered reports can be downloaded manually, Prisma is also capable of sending reports on a schedule automatically. The following steps describe how to subscribe to reports:
- Navigate to Reporting > Reports and click the context menu of a configured report.
- Select Subscribe, choose the render-types to receive and the user media to which the report should be delivered.
- Click on Subscribe. The report card is now colored green and indicates that it is subscribed.
- You’ll now receive reports based on the configured schedule.
All the options in detail can be found in the report subscription documentation.
7. Maintenance configuration
Users can view and configure maintenance for hosts and host groups. Maintenance can be set up with or without data collection and can be applied to all sub-hosts and host groups.
Detailed information about maintenance can be found here.
8. Alert configuration
Alerts allow to configure notifications for specific host groups based on triggered problems with certain severities. These alerts leverage Zabbix’s alert system, including media types to determine where notifications are sent. The push notification feature of IntelliTrend Mobile enhances this functionality by enabling alerts to be received as push notifications on mobile devices.
Detailed information about alerts can be found here.
9. AI configuration
Prisma offers tools to recognize anomalies in Zabbix data by training AI models within Prisma.