Host graph
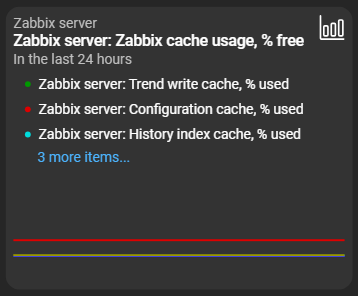
Renders a host graph in a customizable time period.
This widget displays a host graph. The difference between host graph and item graph is, that the item graph can only display the values of a single item. A host graph on the other hand can display the values of multiple items at once.
Configuration
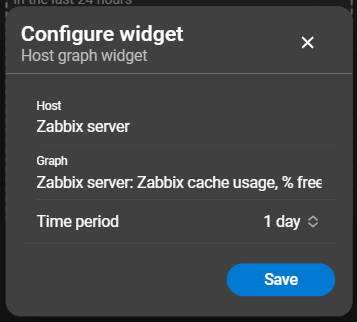
- Host: Host from which the desired graph originates.
- Graph: Graph to be displayed on the dashboard.
- Time period: Determines the displayed values for aggregate, lists and graphs.