Dashboard widgets
A comprehensive overview about all dashboard widget types.
To edit a dashboard, enter the edit mode of a dashboard first by clicking on the wand-button in the top right corner. While being in the edit mode of a dashboard, widgets can be rearranged, resized, configured, added and removed.
Prisma allows to configure and manage multiple dashboards. By default, Prisma users have two predefined dashboards. To switch between those two, or to create a new dashboard, click the dashboard name at the top of the page. This opens a dropdown with all dashboards and the option to create or delete dashboards.
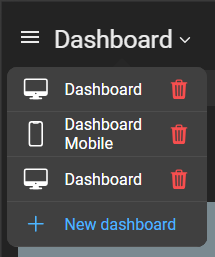
To create a new Prisma dashboard, open the dashboard selection by clicking on your dashboard title in the header. In the dashboard selection, click on New dashboard. This will open the creation dialog.
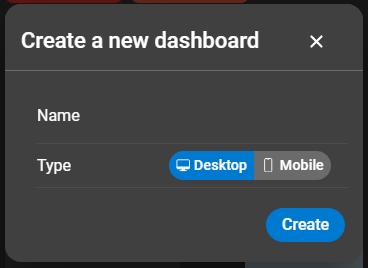
Choose a name and a dashboard type for the new dashboard. After confirming by clicking on Create, the dashboard is being created and automatically opened.
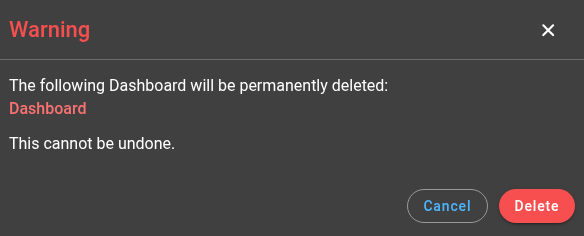
Delete a dashboard by clicking the bin icon next to that dashboard while the dropdown menu is expanded. A warning will appear, informing that the deletion process cannot be undone. Confirm the dialog to complete the deletion.
To resize or rearrange a dashboard widget in the mobile app, long press the dashboard widget you want to resize or rearrange. After long pressing, the widget will be outlined, which indicated that the widget can now be moved and resized.
Drag a widget in order to move it around the dashboard. When dragging the widget from one of its edges, the widget will resize to the direction you drag it.
When being in the edit mode of a dashboard on desktop, every widget will be outlined and ready to be moved or resized.
Drag a widget in order to move it around the dashboard. When clicking the widget at one of its edges, the widget will resize to the direction you drag your cursor.
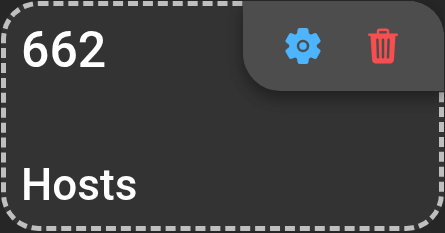
In edit mode, each widget shows context actions in its top-right corner. If a widget supports configuration, the context actions will include a cogwheel button. Clicking the cogwheel button will open the configuration dialog of the widget. Refer to the dashboard widget documentation documentation to learn more about specific widget configuration.
To add a new widget to a dashboard, enter the edit mode and click on the plus button in the bottom right corner. This will open the widget catalogue with all available dashboard widgets. Dashboard widgets are divided into two sections: Zabbix Client and Prisma. Prisma widgets are only available to Prisma users, while Zabbix Client widgets are available to Prisma users and Zabbix Direct users.
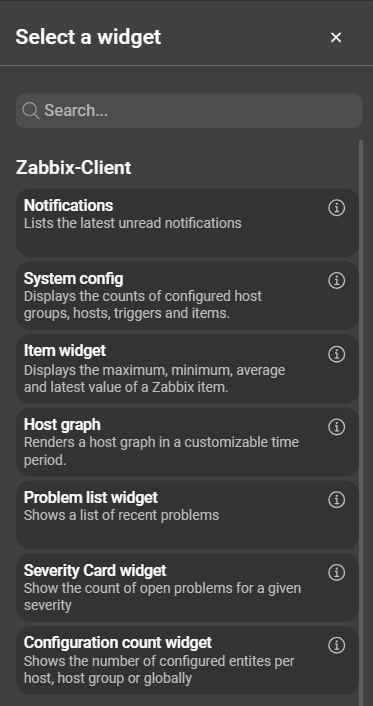
Select a widget from the opened widget catalogue and click it to continue with the configuration of the widget. After completing the configuration of a widget, confirm the dialog with clicking on Save.
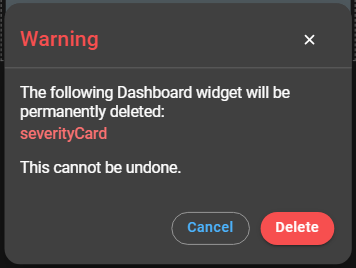
Widgets are removed by clicking the bin button of the respective widget while in edit mode. This will open a warning dialog that needs to be confirmed by clicking Delete.
Dashboard can be reset to the default configuration. This will replace the dashboard configuration with the default dashboard configuration. In order to reset the dashboard to the default dashboard configuration, enter the edit mode and click the red circular arrow button in the top right corner.
After confirming the reset, the dashboard is reset and automatically saved. This action can not be undone.
Dashboards provide an option to clear the entire dashboard. This will automatically remove all widgets of the dashboard. To remove all widgets from the dashboard, enter the edit mode and click the bin button in the top right corner.
After confirming the clear, the dashboard is cleared and automatically saved. This action can not be undone.
To save your dashboard changes on desktop, click on Save in the top right corner of your dashboard.
To save your dashboard changes in the mobile app, click on the checkmark floating action button in the bottom right corner.
To leave the edit mode and discard all changes, click on the cross floating action button in the bottom right corner.
Building a dashboard that works equally well on both mobile and desktop is nearly impossible. To address this, Prisma differentiates between Mobile and Desktop dashboards. Both dashboard types can be opened on any device, but for the best experience it’s recommend to use the dashboard type that matches the device.
By default, every user starts with one mobile dashboard and one desktop dashboard.
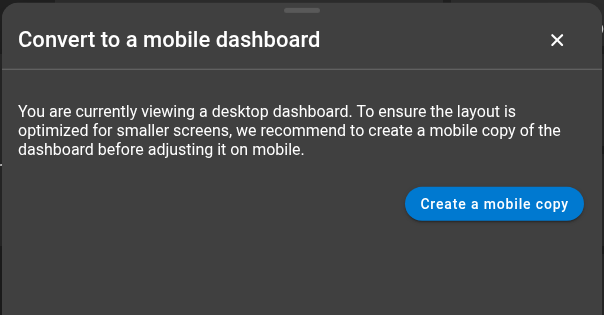
To avoid building the same dashboard twice, Prisma provides an automatic conversion option. When a desktop dashboard is opened on mobile, a banner will appear offering to convert it. Clicking Convert creates a new mobile copy that includes all widgets, their configuration, size, and position. The copied dashboard is completely independent from the original desktop dashboard. The new copied dashboard is independent from the original and any changes made to the new mobile dashboard do not affect the original desktop dashboard.
Elements that originate from the Zabbix Client section can be filtered according to specific hosts and host groups.
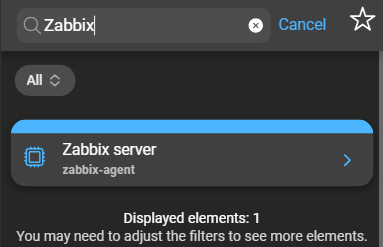
Find more information in the chapter about filtering and favorites.
When being on the dashboard, a bell button is available on the right side of the dashboard title. The notification bell indicates whether notifications are enabled and setup for the Zabbix server or not.
When notifications are not enabled or not setup for your Zabbix server, the notification bell will be colored red. To get more information about the status of push notifications, click the bell button. This will open the Notifications page on which more information about the push notification setup will be provided.
When notification are enabled and fully setup, the bell button will be colored green and show the count of unread notifications in a small badge next to it. The badge will not be shown when there are no unread notifications.
A comprehensive overview about all dashboard widget types.