Instance
The instance dashboard is accessible under Instance > Instance dashboard. The navigation bar at the top of the page is used to switch between different categories:

Server actions
The server actions are accessed through the button next to the dashboard navbar. This opens a dialog with the following options:
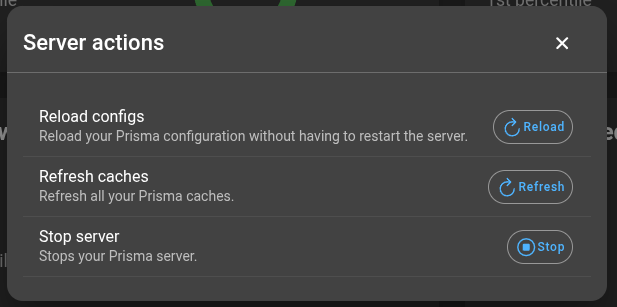
- Reload configs: Reloads the Prisma configuration without restarting the server.
- Refresh caches: Refreshes all Prisma caches.
- Stop server: Stops the Prisma server. If Prisma is deployed in Docker with
restart:set toalways, the server restarts immediately.
Prisma server
The Prisma server section provides:
- Overview of gRPC, Zabbix gRPC, and NSQ-RPC request statistics
- Successful authentication ratio
- Reporting summary
- Recent job queue size
- Job queue size
- Caches
Request overviews
There are four request overviews: gRPC, NSQ-RPC, Zabbix-RPC, and database. They share the same structure, showing request latency and success rate:
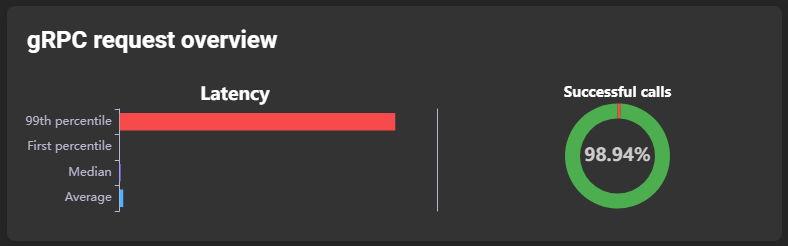
Latency is divided into four subsections:
- 99th percentile: Latency value exceeded by only 1% of requests (worst-case values).
- 1st percentile: Latency value lower than 99% of requests (best-case values).
- Median: Latency median.
- Average: Latency average.
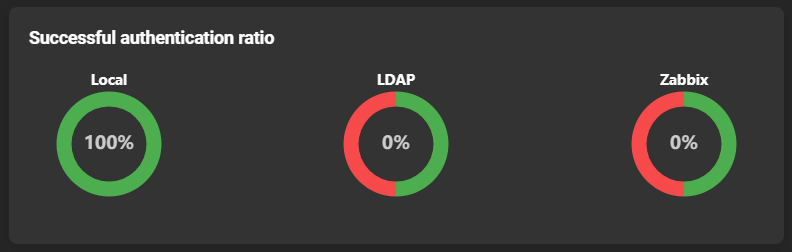
Successful authentication overview
Shows the ratio of successful login processes:
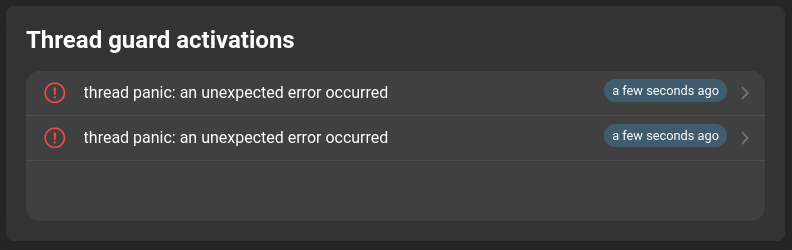
Thread guard activations
Displays the error stack of crashed threads. This information is generated only if threadguardenabled is set to true.
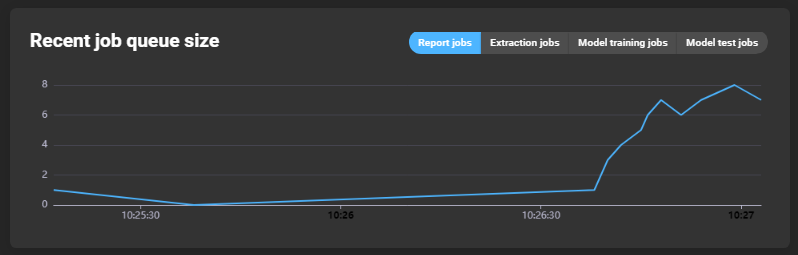
Recent job queue size
Graph showing queued jobs over time. Tabs can be used to select the type of jobs displayed:
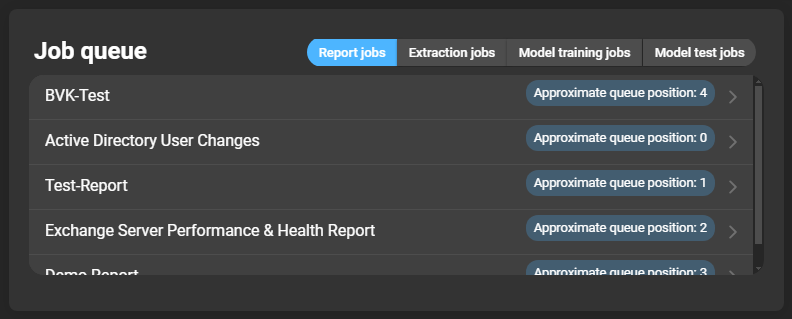
Job queue
List of jobs currently being executed. Each entry shows its position in the queue. Clicking an entry opens the respective job details. Tabs can be used to filter job types:
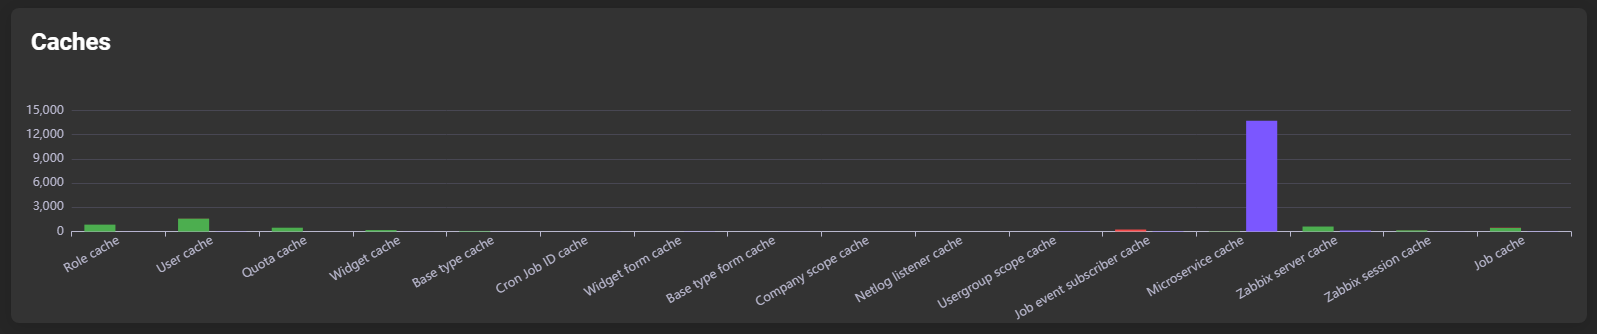
Caches
Displays read/write counts per cache:
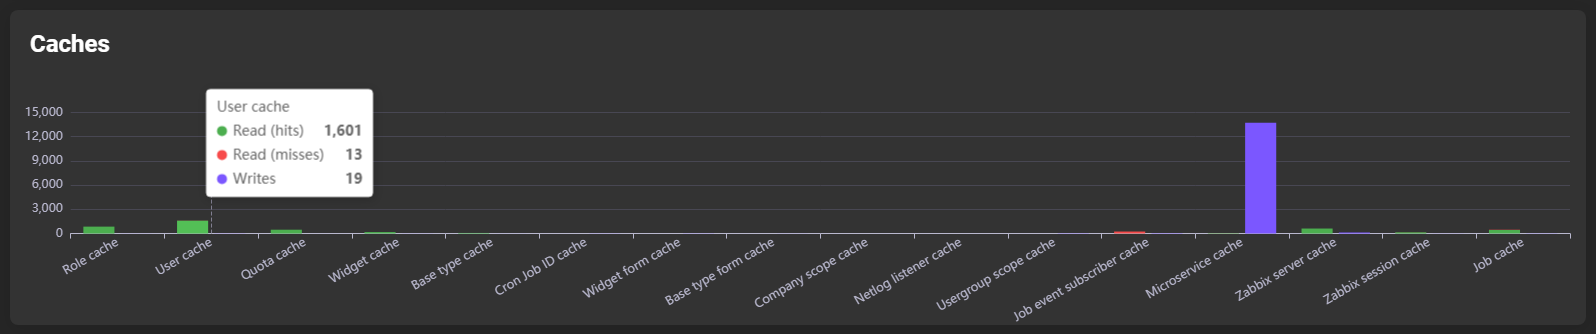
Hovering over a bar shows detailed subdivisions:
RPC stats
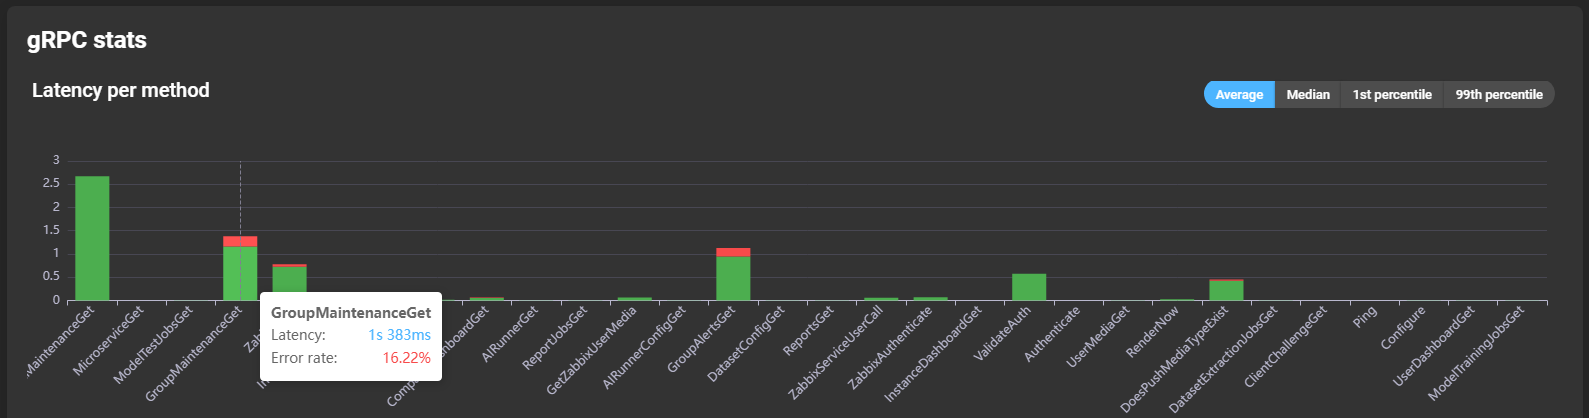
Each RPC stats card has the same structure for gRPC, Zabbix-RPC, and NSQ-RPC. It displays detailed statistics per RPC method. Tabs above the graph switch between average, median, 1st percentile, and 99th percentile views.
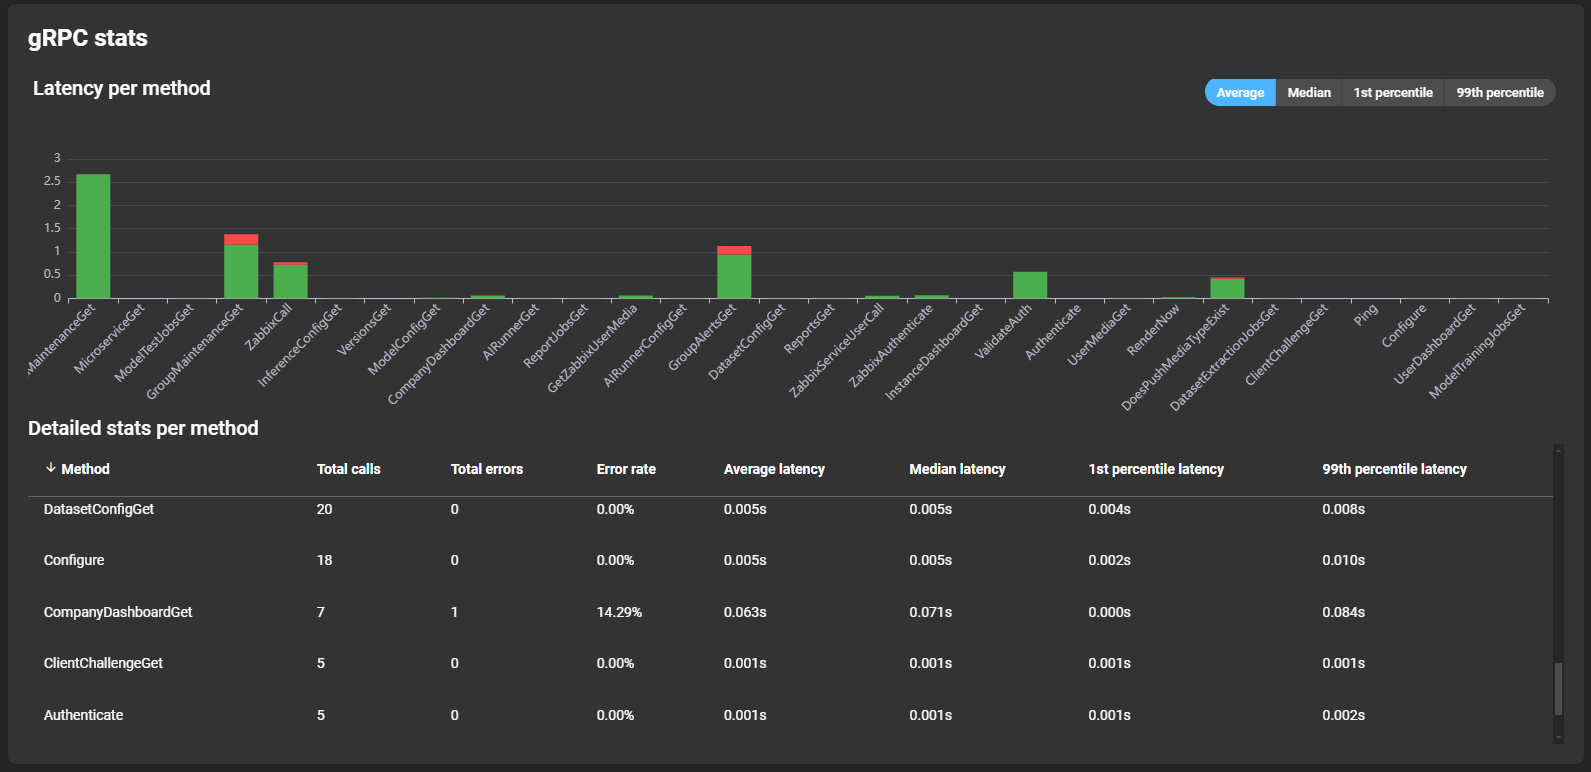
Graphs show latency per method. Hovering over a bar reveals latency and error rate details:
Details per method are listed below the graph:
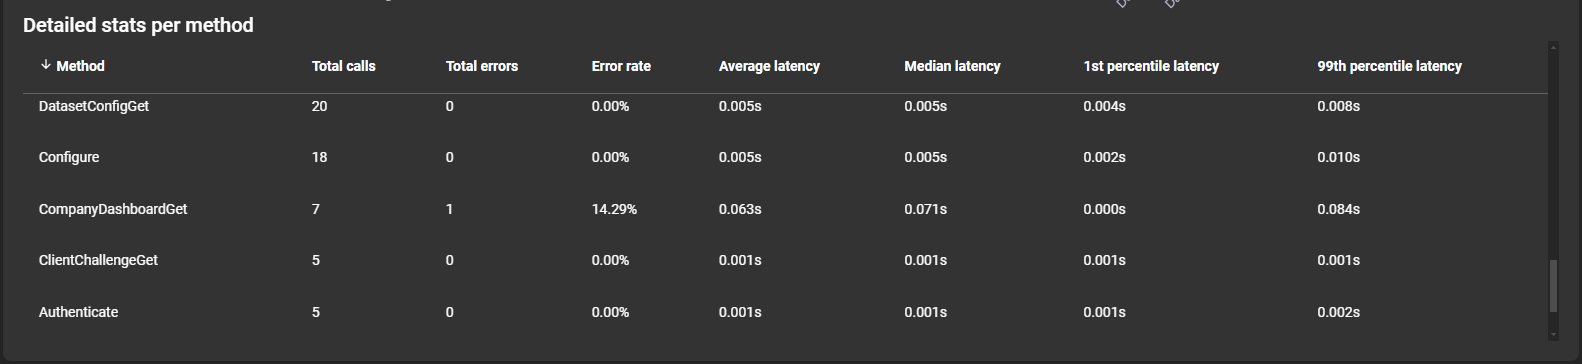
- Method: Name of the method.
- Total calls: Total number of calls.
- Total errors: Total number of errors.
- Error rate: Ratio of errors to total calls.
- Average latency: Average method latency.
- Median latency: Median method latency.
- 1st percentile latency: Best-case latency.
- 99th percentile latency: Worst-case latency.
Microservices
All microservice pages follow the same structure. The following microservices have details: Collectors, Renderers, Deliverers, Preprocessors, AI Trainers, and AI Testers.
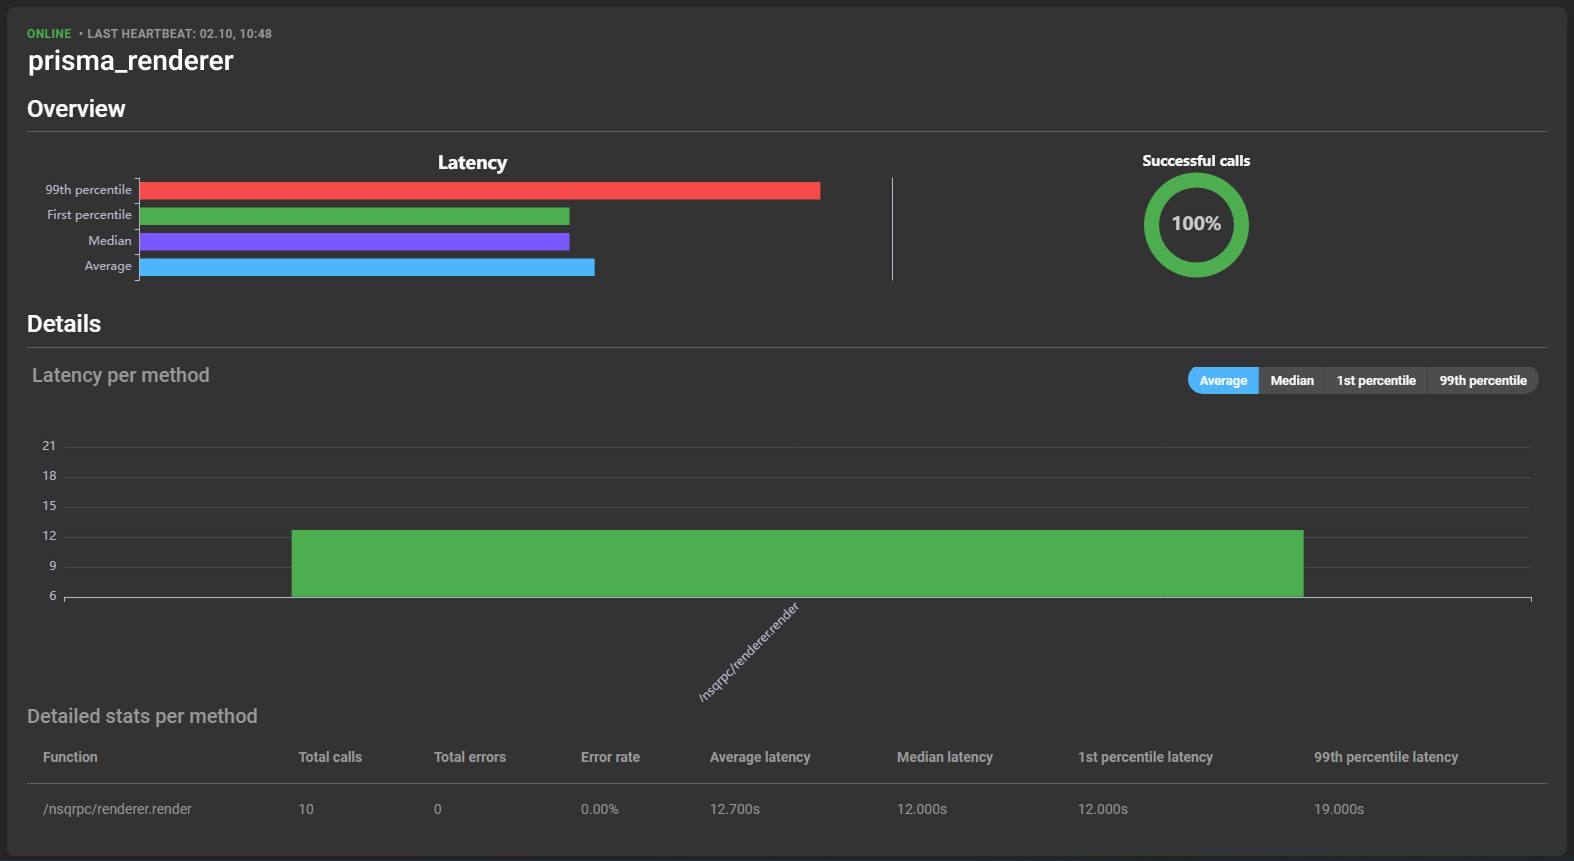
General
Displayed at the top of the card:
- Status: Indicates whether the service is online or offline.
- Last heartbeat: Date and time of the last action registration.
- Name: Name of the service.

Overview
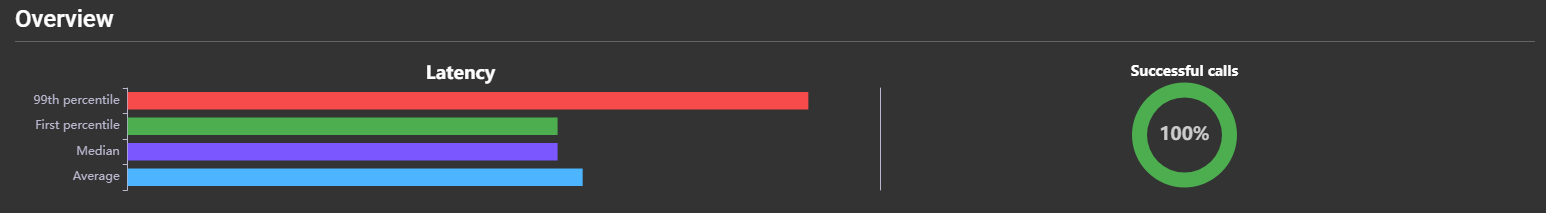
Provides information about latency and success rate of service calls, divided into:
- 99th percentile: Worst-case latency.
- 1st percentile: Best-case latency.
- Median: Median latency.
- Average: Average latency.
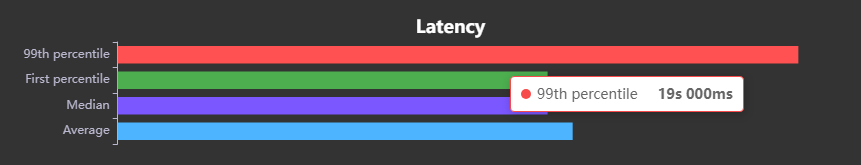
Hovering over a latency bar shows specific values:
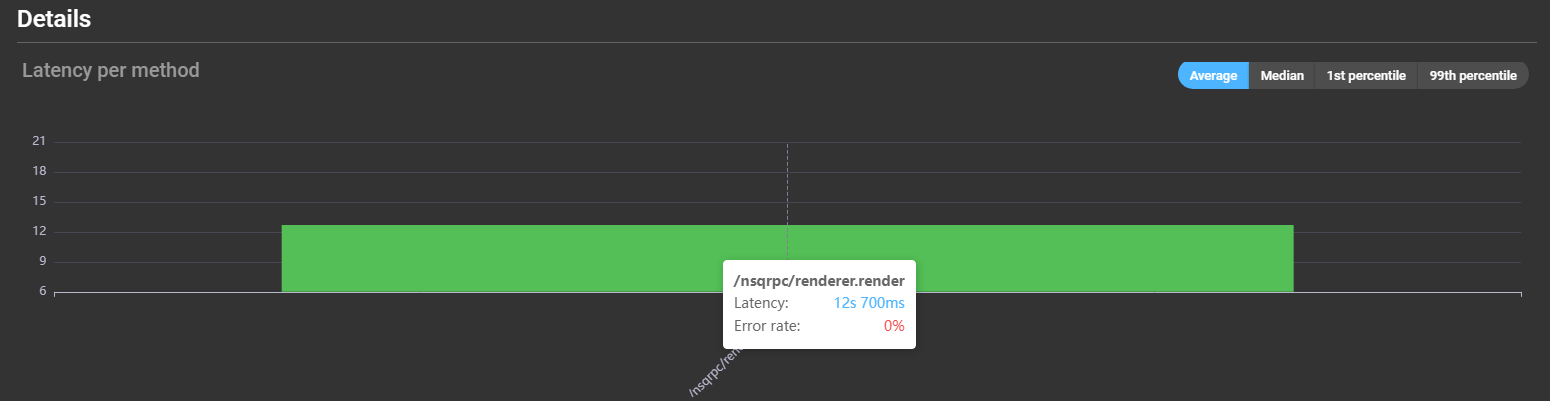
Details
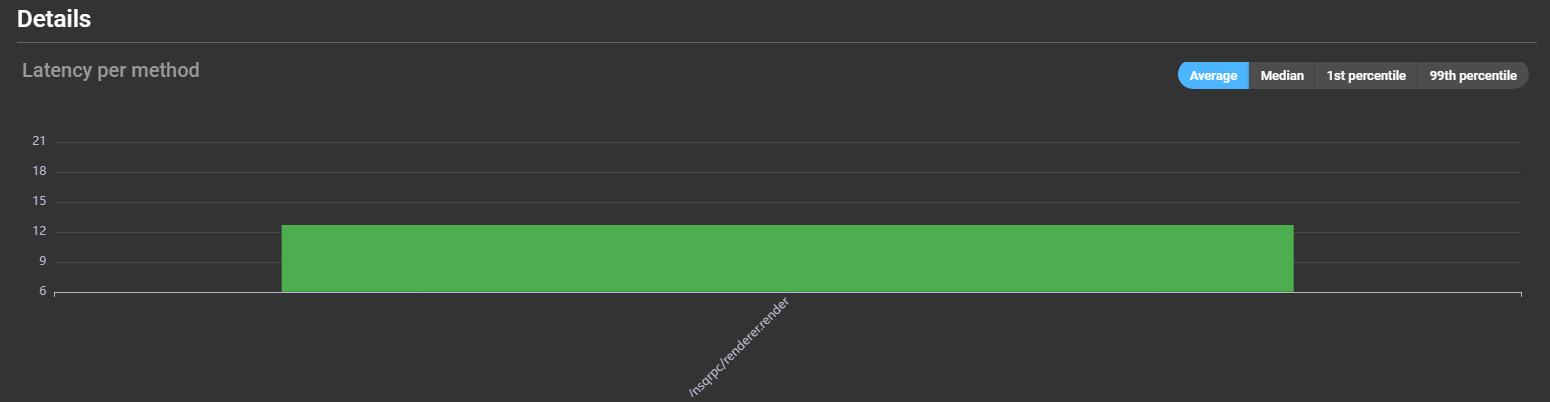
Graphs display latency of different methods. Hovering over a bar reveals latency and error rate details:
A detailed list is provided below:

- Method: Name of the method.
- Total calls: Total number of calls.
- Total errors: Total number of errors.
- Error rate: Ratio of errors to total calls.
- Average latency: Average method latency.
- Median latency: Median method latency.
- 1st percentile latency: Best-case latency.
- 99th percentile latency: Worst-case latency.