Services
Service list
The list displays all services with their respective names. If a service has one or more child services, they can be revealed by clicking the arrow next to the service name.
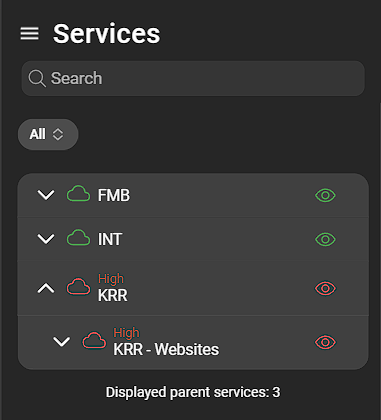
If there are no problems, the cloud icon of the service is green. If problems exist, the name of the highest severity level is displayed and the cloud color changes accordingly.
Clicking a service, whether parent or child, opens the service details.
Filtering services
Various filters can be applied to focus on services matching specific criteria.
Services with problems filter
This filter allows services to be filtered according to their state. There are three options:
- All: All services, regardless of state, are displayed.
- Services with problems: Only services with problems are displayed.
- Services in OK state: Only services without problems are displayed.
Service details
Provides information about the service status, name, and additional details:
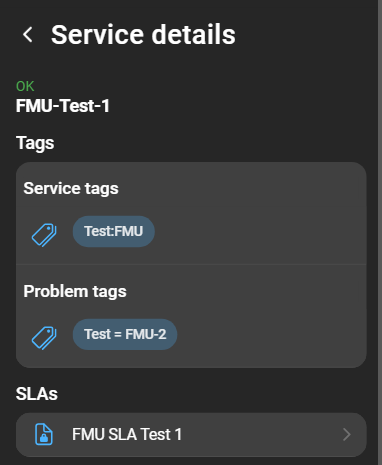
- Service tags: Displays the service tags of the service.
- Problem tags: Displays the problem tags of the service.
- SLAs: A list of SLAs the service is mapped with. Clicking an SLA shows the SLA details.
Service uptimes
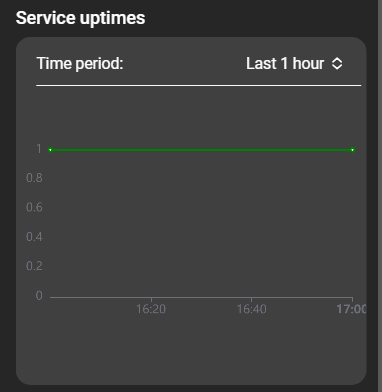
Displays the uptime of the service over a specified period. The time period can be selected from a dropdown. If the default options are insufficient, a custom time period can be specified. The graph displays the up- and downtime of the service for the selected period. A service is considered up as long as it is in the OK state, shown in the graph with the value 1. Otherwise, the service is considered down, represented by the value 0.
SLAs
SLAs , or Service Level Agreements, are integral for monitoring services to ensure they meet performance requirements. These requirements are defined as SLOs, or Service Level Objectives, and include aspects such as expected uptime and planned downtimes. The dependency between services and SLAs is implemented using service tags, and a single SLA can be assigned to several services.
SLA details
SLAs do not have a dedicated section within DataForge but can be examined by navigating to the services page and inspecting a service details page (as explained in Service details). SLA details can be viewed by clicking the corresponding SLA link.
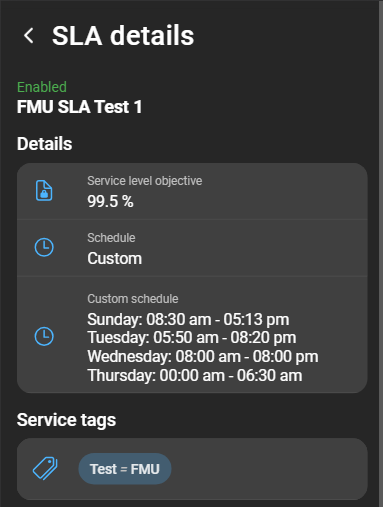
The details page of an SLA displays information about whether the SLA is enabled, followed by its name. The details section includes:
- SLO (Service Level Objective): Specifies the required uptime, excluding planned downtimes.
- Schedule: Displayed as
Always(Zabbix’s24x7option) or as a detailed custom schedule. - Custom schedule: Displays the details of the custom schedule.
- Service tags: Displays the service tags associated with the SLA.
SLI details
The SLI (Service Level Indicator) provides insights into the amount of time a service remains in an OK state (uptime) or a Problem state (downtime). The graph illustrates these for the services covered by the SLA. Any excluded downtimes specified in the SLA configuration are not considered in this calculation.
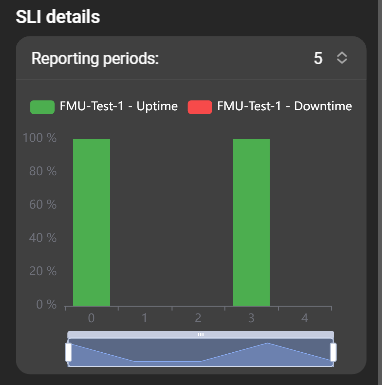
The number of periods displayed can be adjusted using the Reporting periods dropdown menu. Hovering over the bars of the graph provides detailed information about each period, and data zoom allows closer inspection of specific time intervals.
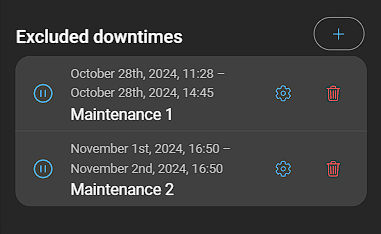
Excluded downtimes
A list of excluded downtimes is shown below the graph. Excluded downtimes are visible in this list. Excluded downtimes can be created, configured, and deleted for an SLA if the user account has the necessary Zabbix permissions.
Add excluded downtime
To add an excluded downtime, click the Plus button. This opens the following form:
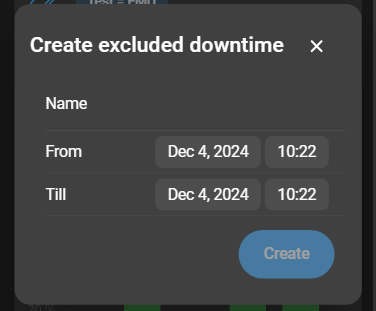
- Name: The name of the excluded downtime.
- From: The start time of the excluded downtime.
- Till: The end time of the excluded downtime.
Click Create to add the excluded downtime.
Configure excluded downtime
A downtime can be edited by clicking the Cogwheel icon of the downtime. This opens a form with the same options as when creating an excluded downtime. Click Save to apply the changes.
Delete excluded downtime
To delete an excluded downtime, click the Bin icon of the corresponding downtime. A warning opens asking for confirmation. To confirm, click Delete again.