Instance
The instance dashboard can be viewed under Instance > Instance. To navigate through the different categories, use the navigation bar at the top of the page:

Server actions
The server actions can be accessed by clicking the corresponding button next to the dashboard navbar. This will open a modal with the following options:
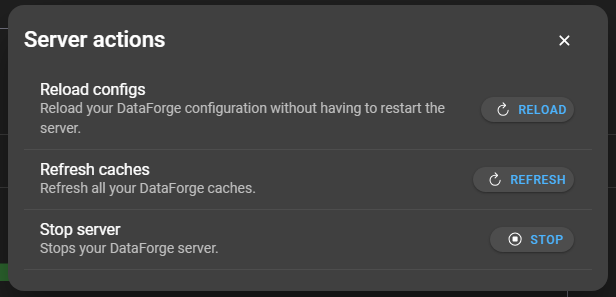
- Reload configs: Reload your DataForge configuration without having to restart the server.
- Refresh caches: Refresh all your DataForge caches.
- Stop server: Stops your DataForge server. If DataForge is deployed on a docker and
restart:is set toalways, the server will restart immediately after.
DataForge server
The DataForge server section provides:
- Overview of gRPC, Zabbix gRPC and NSQ-RPC stats requests and stats
- Successful authentication ratio
- Reporting summary
- Recent job queue size
- Job queue size
- Caches
Request overviews
There are four request overviews: gRPC, NSQ-RPC, Zabbix-RPC and database. They are always structured in the same way, they provide an overview of the latency of the requests and a success rate:
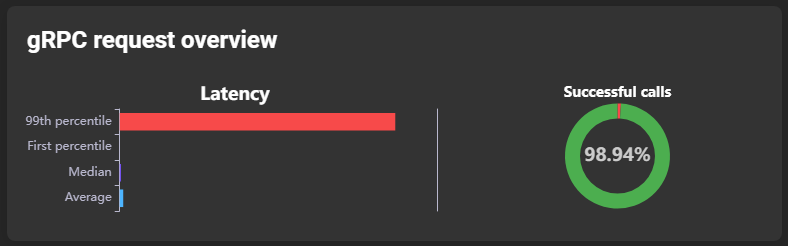
The latency is further divided into four subsections:
- 99th percentile: The 99th percentile indicates which of a series of values was higher, and therefore worse, than 99% of the other values.
- First percentile: The first percentile indicates which of a series of values was smaller, and therefore better, than 99% of the other values.
- Median: Indicates the latency median.
- Average: Indicates the latency average.
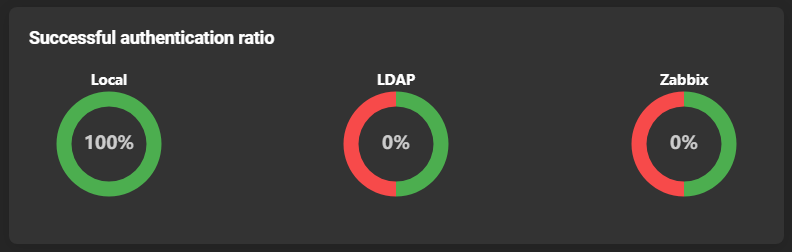
Successful authentication overview
Describes the ratio of how many of the various login processes were successful:
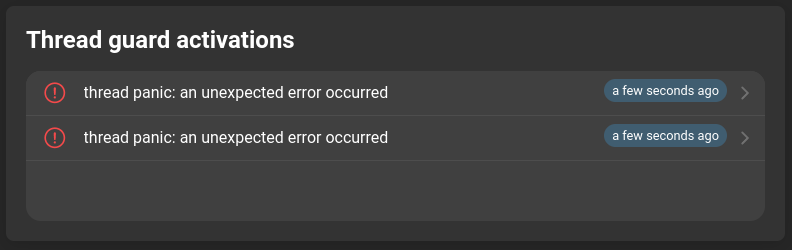
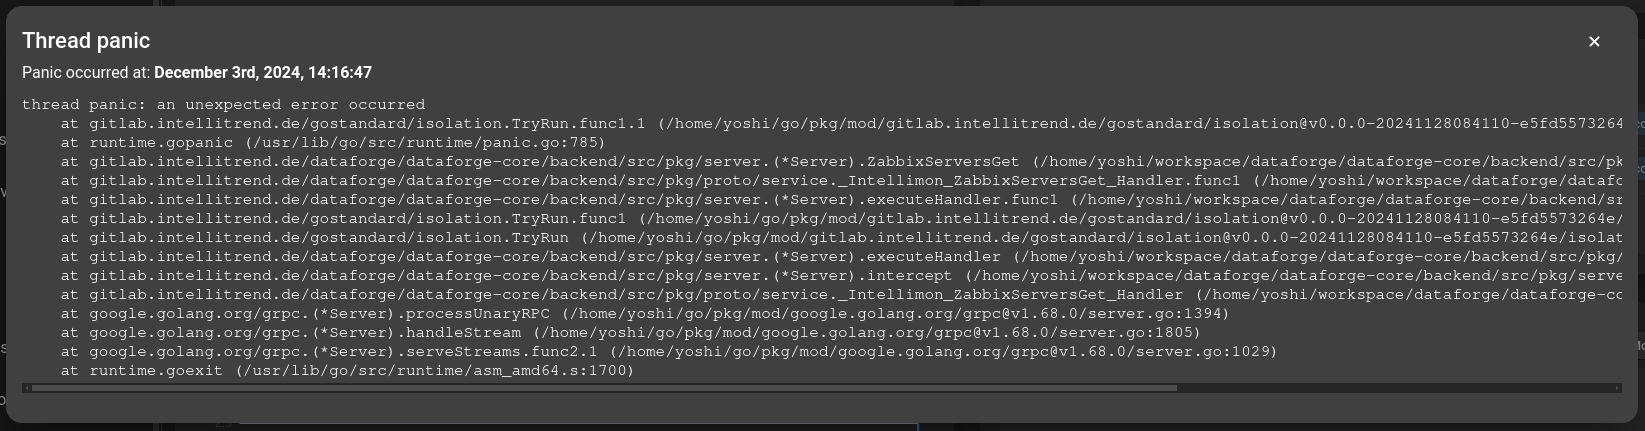
Thread guard activations
The error stack of a crashed thread. This information will only be generated if the threadguardenabled is set to true.
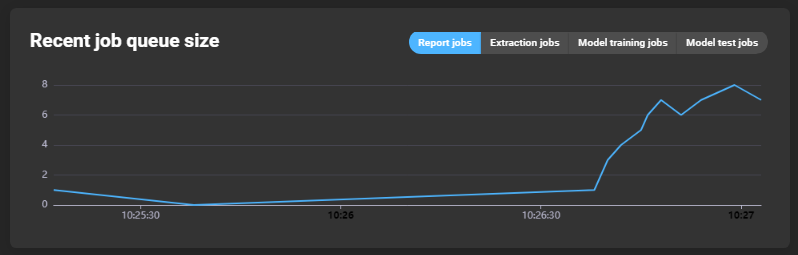
Recent job queue size
A graph showing how many jobs were queued at what time. The tabs can be used to select the jobs for which the graph is to be rendered:
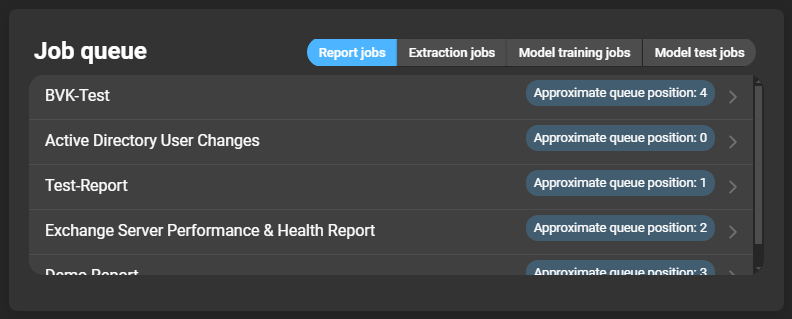
Job queue
The job queue is a list of jobs that are still being executed. Each entry has an indicator of its place in the queue. If you click on an entry, you will be forwarded to the respective job details. The tabs can be used to change the type of jobs to be listed:
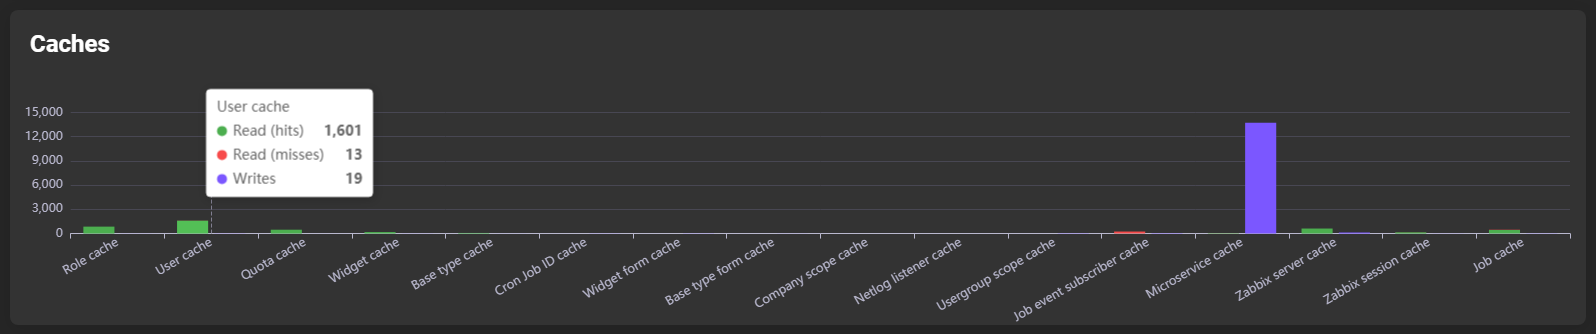
Caches
Shows the number of reads/writes per cache:
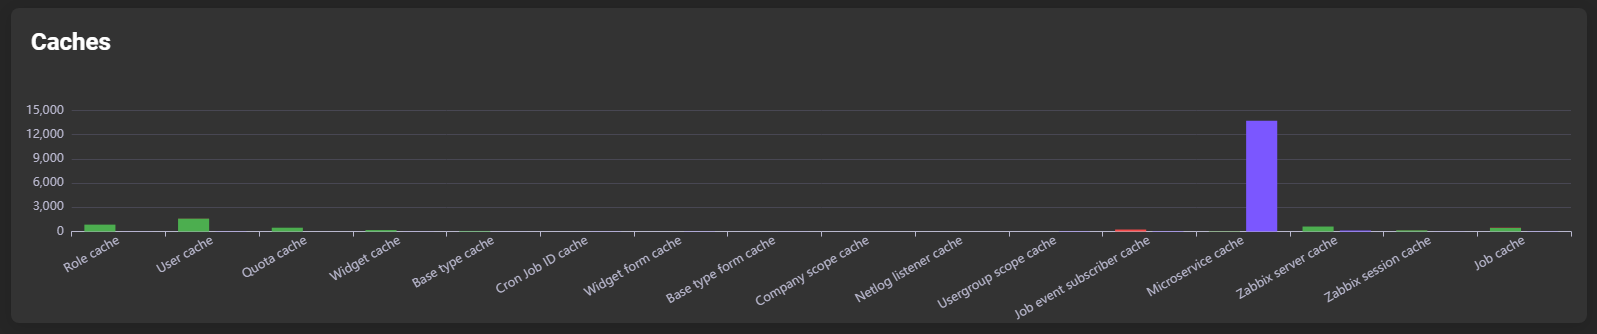
If you hover over the bar of a cache type, a more detailed subdivision is displayed:
RPC stats
Each RPC stats card has the same structure and exists for the types: gRPC, Zabbix-RPC and NSQ-RPC. In general, it is used to display more precise statistics per RPC method. You can switch between “average, median, 1st percentile and 99th percentile”, by clicking the corresponding tabs above the graph.
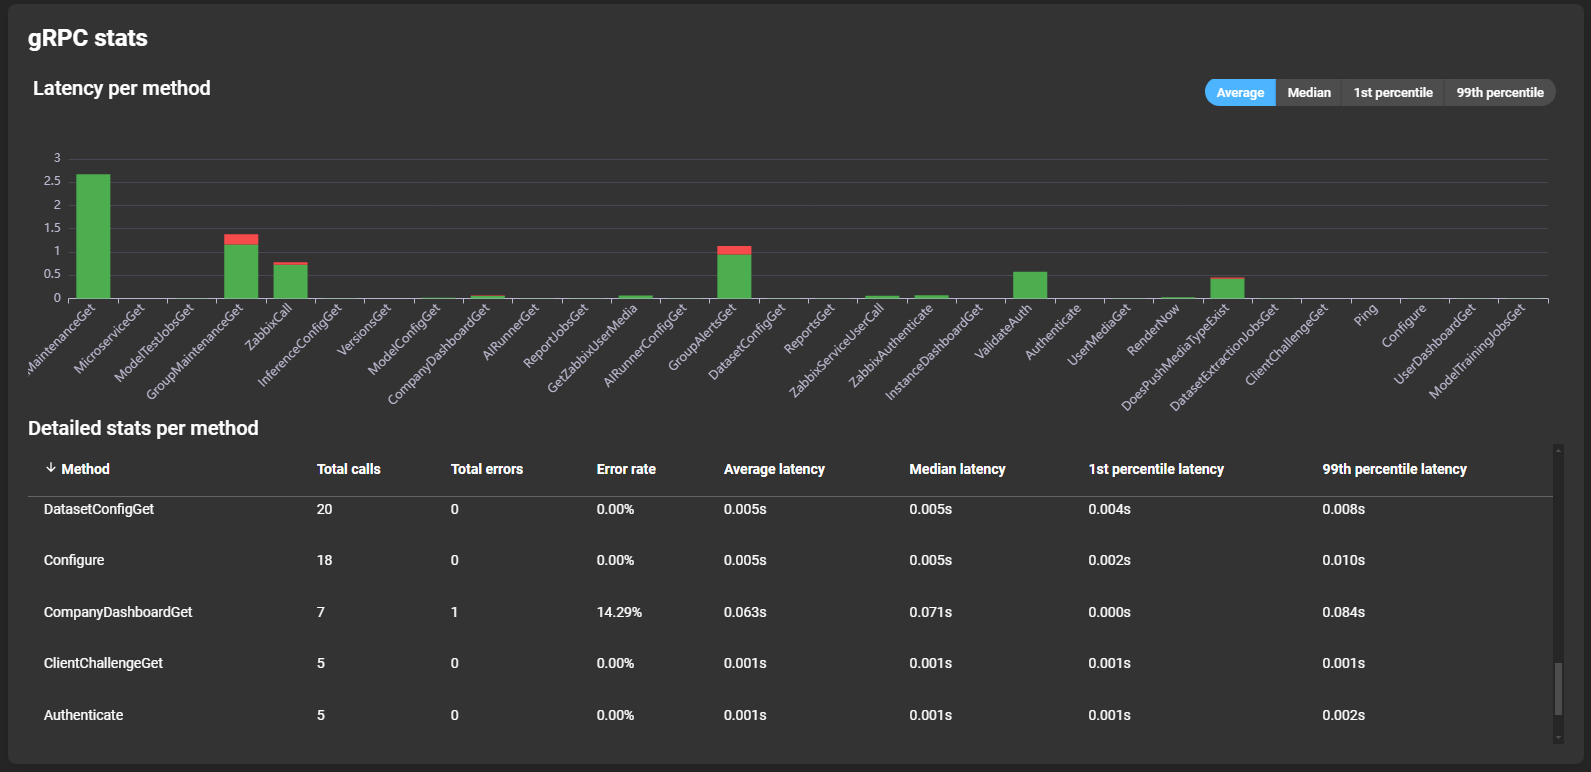
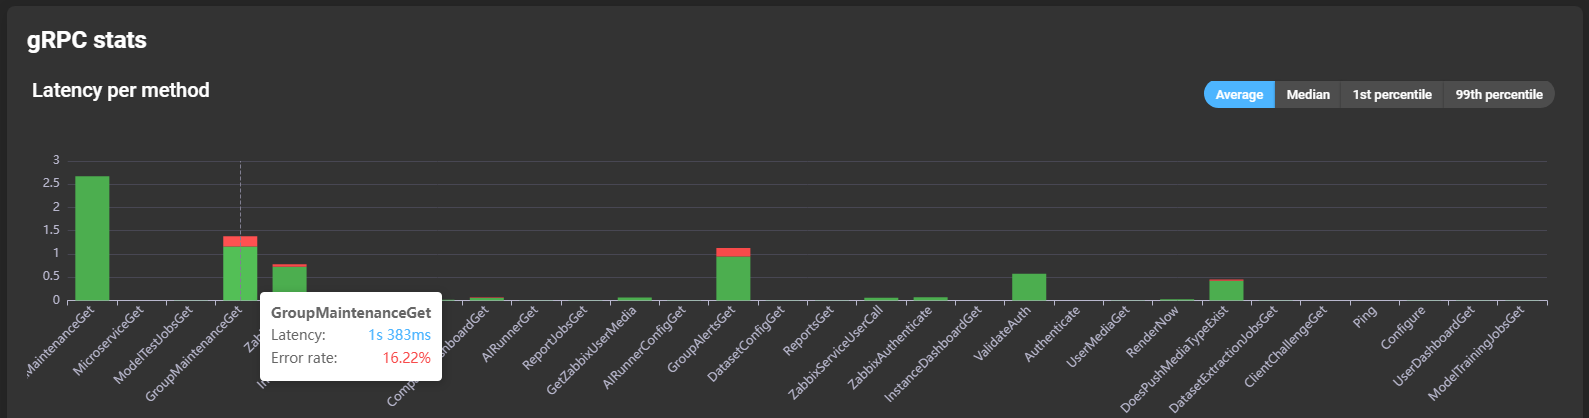
Information about the latency of the different methods can be read from a graph showing the different methods. You can hover over a bar to see details about the method’s latency and error rate:
More details per method are displayed in the list below the graph:
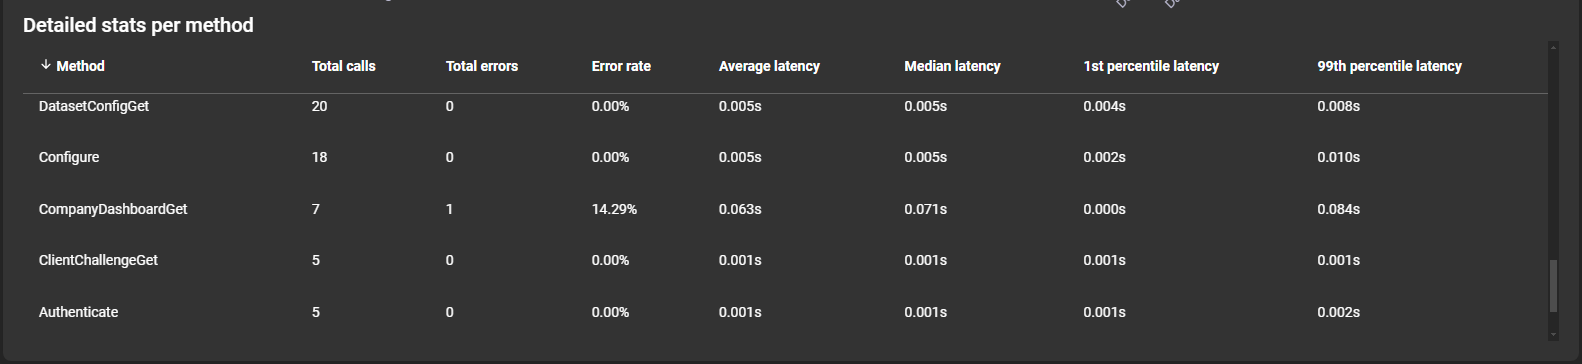
- Method: The name of the method.
- Total calls: The total amount the method was called.
- Total errors: The total amount of errors while calling the method.
- Error rate: The relative amount of total errors compared to the total amount of calls.
- Average latency: The average latency of the method call.
- Median latency: The median latency of the method call.
- 1st percentile latency: The 1st percentile latency of the method call.
- 99th percentile latency: The 99th percentile latency of the method call.
Microservices
Every microservice page has the same structure. The microservices for which there are details are as follows: Collector, Renderers, Deliverers, Preprocessors, AI trainer, AI tester, and push servers:
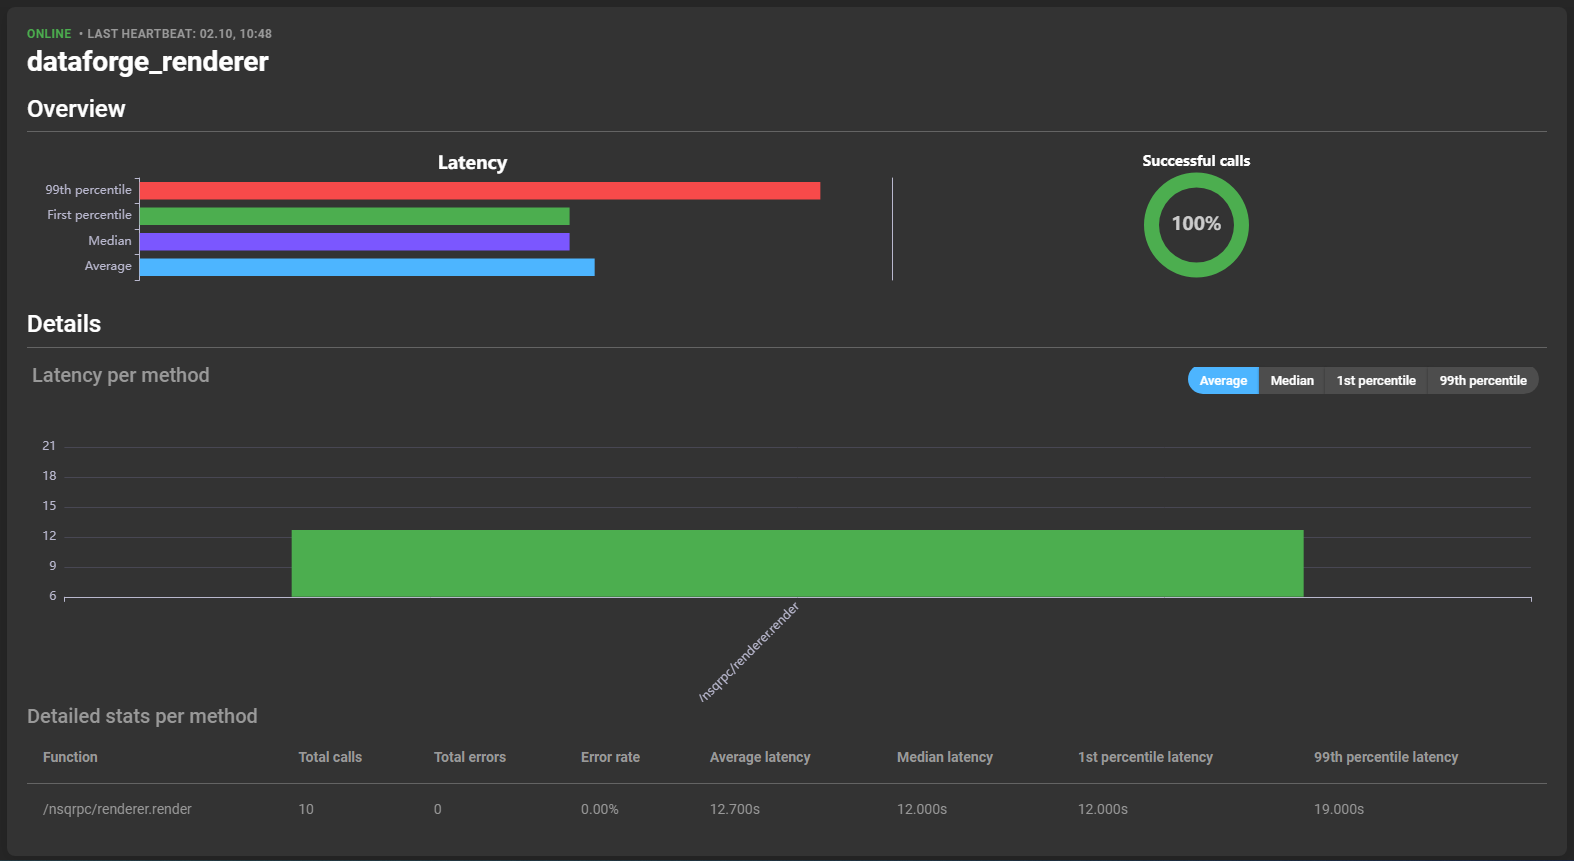
General
Three information points can be found at the top of the card:
- Status: Indicates if the service is online or offline.
- Last heartbeat: The date and time of the last registration of an action by the service.
- Name: The name of the service.

Overview
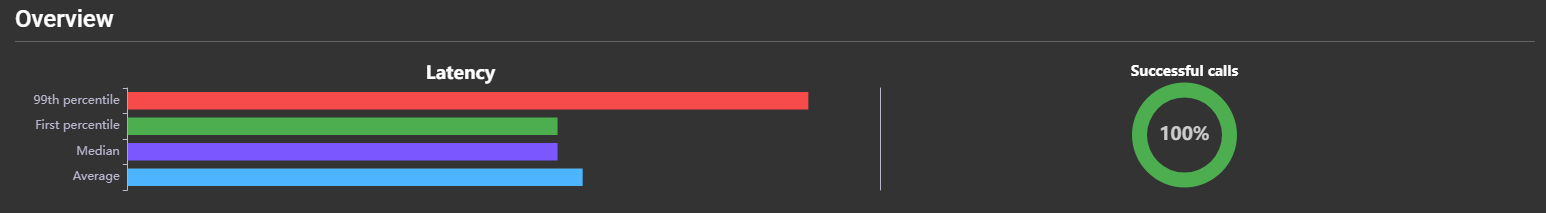
Provides information about the latency and success rate of the services’ calls. The latency is divided into four subcategories:
- 99th percentile: The 99th percentile indicates which of a series of values was higher, and therefore worse, than 99% of the other values.
- First percentile: The first percentile indicates which of a series of values was smaller, and therefore better, than 99% of the other values.
- Median: Indicates the latency median.
- Average: Indicates the latency average.
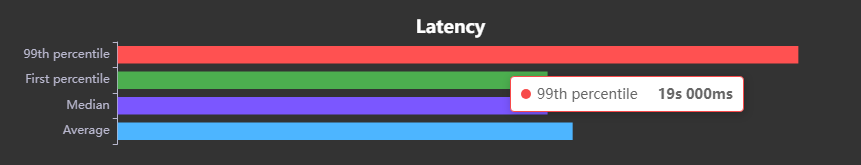
By hovering over a latency bar, you can see specific values about that category:
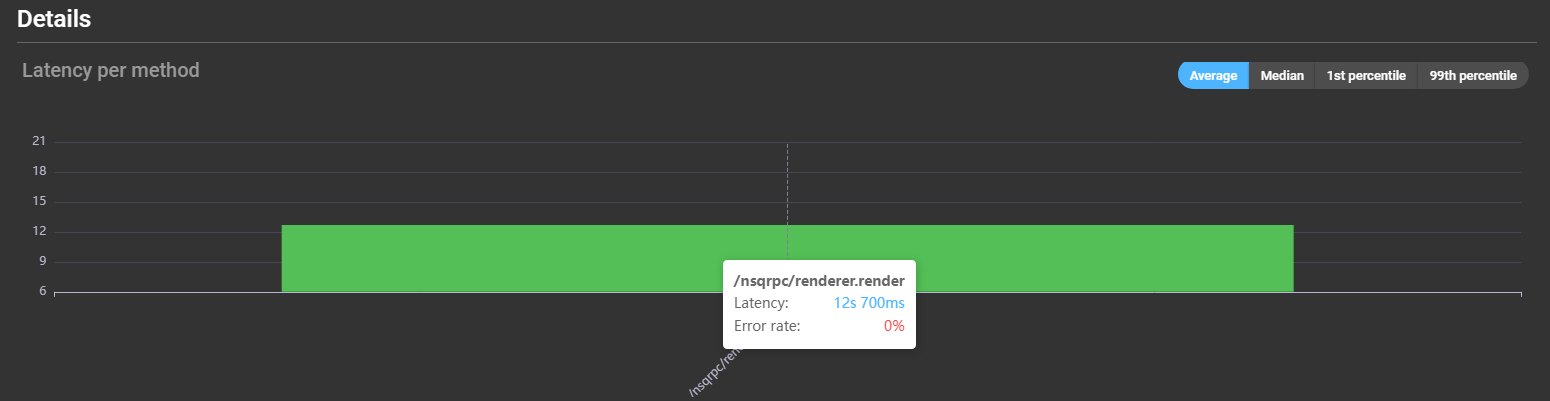
Details
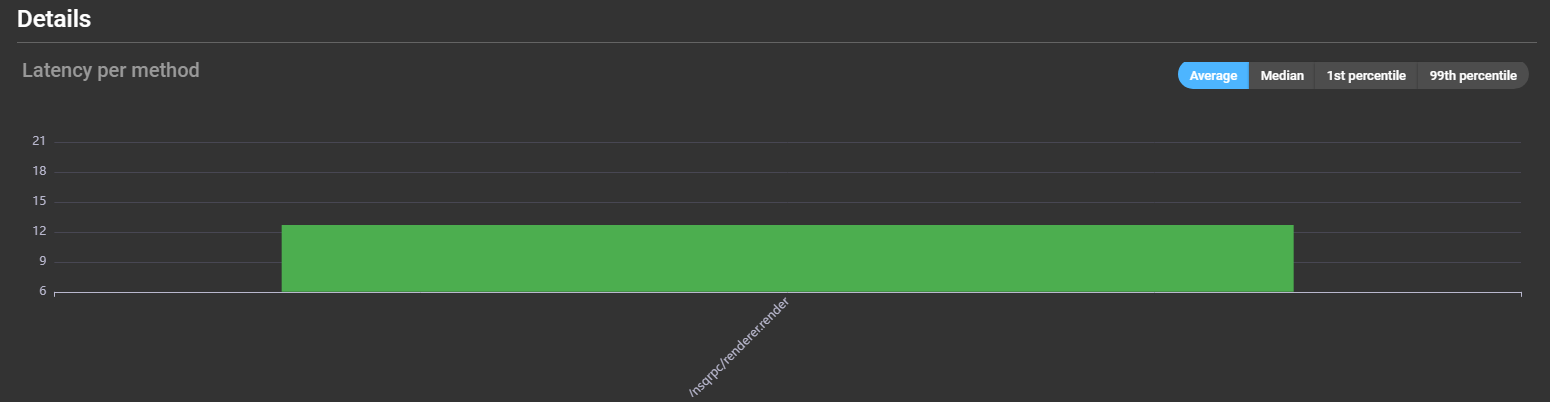
Information about the latency of the different methods can be read from a graph showing the different methods. You can hover over a bar to see details about the method’s latency and error rate:
More details per method are displayed in the list below the graph:

- Method: The name of the method.
- Total calls: The total amount the method was called.
- Total errors: The total amount of errors while calling the method.
- Error rate: The relative amount of total errors compared to the total amount of calls.
- Average latency: The average latency of the method call.
- Median latency: The median latency of the method call.
- 1st percentile latency: The 1st percentile latency of the method call.
- 99th percentile latency: The 99th percentile latency of the method call.