Host numeric item
This widget retrieves numerical item data of a host from a Zabbix server displays it as a graph, alongside further information like the host’s
id and interfaces.The configuration of a Host numeric items widget offers the following options (aside from the general settings of a widget):

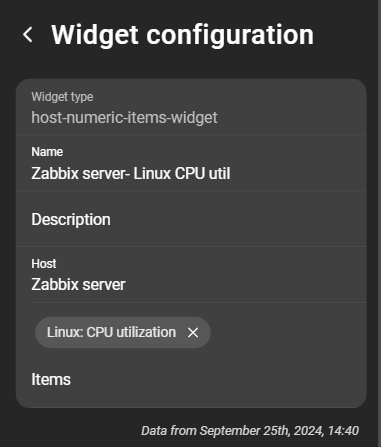
- Host: Choose a host that contains the numeric items to be included in the report.
- Items: Select an item whose values are displayed in the report.
Render examples
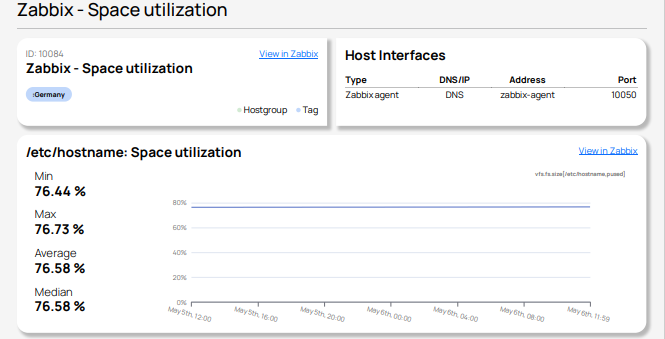
The PDF render not only displays the fetched data in a graph, it also offers information about the following:

- The host, including the the host groups it belongs to and it’s
tagsin form of chips. - The host’s interfaces. The list is displaying:
Type,DNS/IP,Address, andPort. - The item’s Name, Item type and Key.
- The Minimum, Maximum, Average and Median of the item’s collected data within the report interval.
- A graph visualizing the collected data.
This JSON is shortened and shows no redundant data.
{
	"displayName": "Zabbix server CPU",
	"name": "host-numeric-items-widget",
	"description": "Information about CPU utilization and idle time.",
	"version": "",
	"error": "",
	"host": {
		"name": "zabbix-agent",
		"id": 10084,
		"description": "",
		"groups": [
			"Zabbix servers"
		],
		"tags": [
			{
				"tag": "Location",
				"value": "Germany"
			}
		],
		"interfaces": [
			{
				"available": 1,
				"disable_until": 0,
				"dns": "zabbix-agent-test",
				"errors_from": 0,
				"hostid": "10084",
				"interfaceid": "1",
				"ip": "127.0.0.1",
				"main": 1,
				"port": "10050",
				"type": 1,
				"useip": 1
			}
		]
	},
	"items": [
		{
			"description": "The time the CPU has spent doing nothing.",
			"hostName": "Zabbix server",
			"hostID": 10084,
			"itemKey": "system.cpu.util[,idle]",
			"itemName": "CPU idle time",
			"itemID": 42264,
			"dataType": 0,
			"units": "%",
			"history": [
				{
					"ts": 1732719564,
					"val": 93.034699
				},
				{
					"ts": 1732719624,
					"val": 91.081562
				}
			],
			"aggregate": {
				"min": 73.586662,
				"max": 95.742684,
				"avg": 94.2827776577795
			}
		}
	]
}