Dashboard
The dashboard’s content is categorized into sections to provide a structured overview. The first section of the dashboard is dedicated to displaying information from the Zabbix client. The second section focuses on Reporting and provides insights into report generation, distribution, and other reporting-related functionalities. The third section is related to Self Provisioning and presents information about host and host group maintenances, as well as alerts.
Every entity card offers a shortcut to the corresponding sections of the Zabbix Client with the relevant filters applied.
Zabbix server and version
At the top left corner of the dashboard, you’ll find information about your Zabbix server installation:
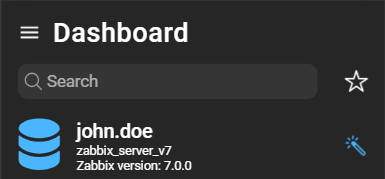
- User: The user you are logged in with.
- Server: Displays the server address. When loggin as a DataForge user, the server alias will be displayed.
- Zabbix version: The version of Zabbix that your server is running.
- Wand icon: Can be used to customize the contents of the dashboard.
Customizing the dashboard
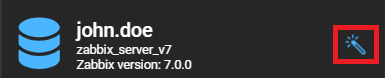
The information shown across the dashboard can be customized by clicking the wand icon. Each active section of the dashboard is listed as a widget. These widgets can be added, rearranged or removed. The order of the list determines the order of the widgets on the dashboard.
To customize the information shown across the dashboard just click the wand icon next to the server and user info:
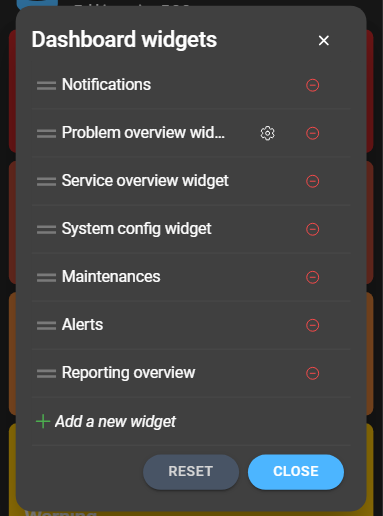
The following configuration page lists all currently active widgets:
Dashboard widget types
The dashboard offers a lot of different widget types. Each widget has it’s own sub-chapter for more information about what the widget will display.
Adding widgets
You can add widgets to the dashboard by clicking Add a new widget at the bottom of the Dashboard widgets page:
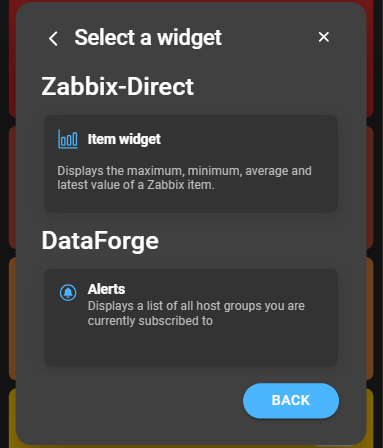
This page will show widgets divided into two sections: Zabbix-Direct and DataForge. DataForge widgets can not be used when using Zabbix-Direct. Only widgets that are not added to the current selection are shown here. Click on a widget card to add it to the bottom of the widget list.
Rearrange widgets
To change the order of widgets displayed on the dashboard just drag and drop the corresponding widgets in the list. These changes will be immediately applied without the need to save.
Remove widgets
To remove widgets click the red remove icon next to the widget you want to remove.
Search and favorites
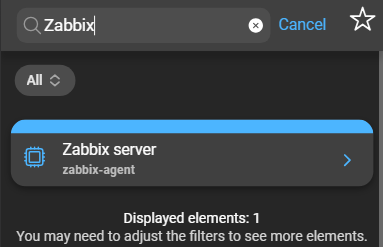
Elements that originate from the Zabbix Client section can be filtered according to specific hosts and host groups.
- Open the search function by clicking the magnifying glass. It opens the hosts page and allows a quick way to filter for specific hosts.
- If favorites are applied only Zabbix Client elements of that host or host group will be displayed on the dashboard. Favorites can be accessed by clicking the star icon.
You can find more information in the dedicated chapter about filtering and favorites.
Notifications
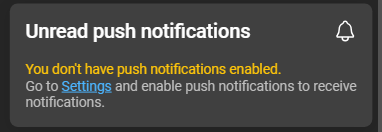
IntelliTrend Mobile for Zabbix offers a unique push notification service. A detailed guide on how to use this service can be found in its corresponding chapter push notifications. This push notification card list the last two unread push notification if enabled.
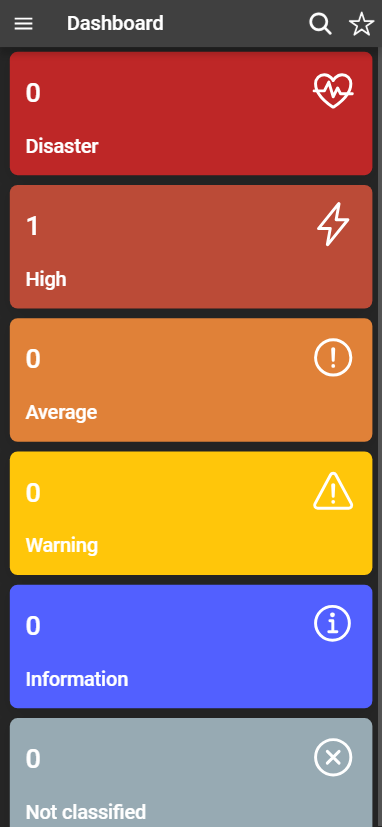
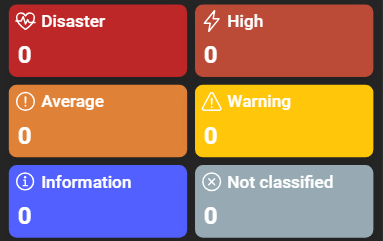
Problems overview
Offers an overview of all currently open problems detected on your Zabbix server. These are subdivided into six severity cards, displaying the count of currently open problems of each severity, except for suppressed problems.
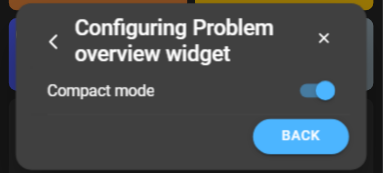
Compact mode
When customizing the dashboard, you have the option to display the problem widget in compact mode:
To enable the compact mode just click the settings icon next to the problems overview widget and enable the compact mode:
Service overview
Service monitoring is focusing on the overall availability of a service. These states are depicted on two different cards: Services in OK state and Services with problems:
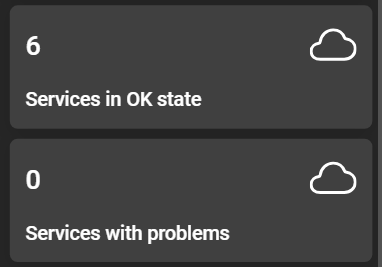
- Services in OK State: Represents the number of services that are currently in an
OKstate. - Services with Problems: Represents the number of services that are experiencing problems.
For more in-depth information on SLAs in Zabbix, you can refer to the official Zabbix documentation .
System configuration
Four cards that serve as a quick reference to the major components of your Zabbix monitoring environment and allow you to navigate to the corresponding sections.
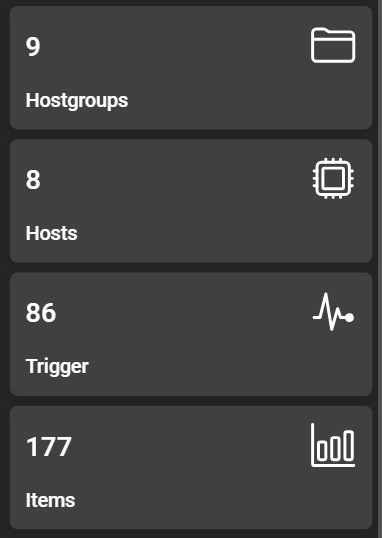
- Host Groups: Displays the total count of host groups in your Zabbix monitoring system.
- Hosts: Indicates the total number of hosts being monitored in your Zabbix environment.
- Triggers: Shows the total count of triggers that are set up in your Zabbix system.
- Items: Displays the total number of items defined in your Zabbix configuration.
Maintenances
The section of the dashboard provides an overview of the Self provisioning maintenance feature.
Host Maintenances
Clicking on an entry will open the host maintenance page in self provisioning with the corresponding filter applied. This allows you to manage the maintenance for that host.

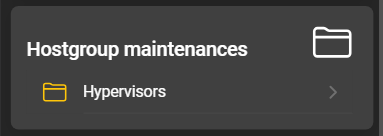
Host group Maintenances
Clicking on an entry will open the host group maintenance page in self provisioning with the corresponding filter applied. This enables you to manage the maintenance for that host group.
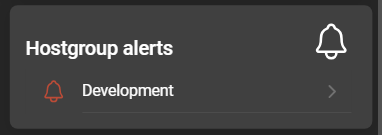
Alerts
If you click on an entry, it will navigate you to the alerts page in self provisioning with the corresponding filter applied, allowing you to manage your alerts for that specific host group.
Reporting overview
Reporting consists of templates and reports. The reports can then be distributed and managed via subscriptions. Three cards represent these components of DataForge. Each of these cards provides a link to the configured entity.
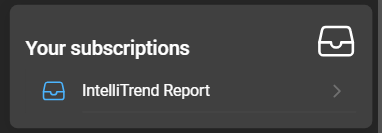
Your subscriptions
Displays a list of reports that you are currently subscribed to. Clicking on a subscription will navigate you to its settings page.
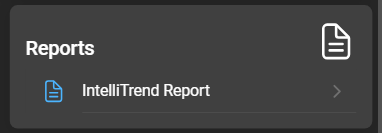
Reports
Shows a list of reports that have been created. By clicking on a report, you will be navigated to its configuration page.
Templates
Lists the templates that have been created for generating reports. Clicking on a template will direct you to the templates configuration page.
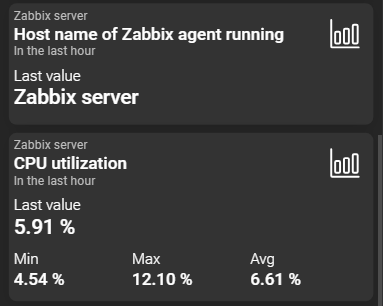
Item
The freely configurable dashboard item widget that can display a single item of a host. It can be added as many times as desired, but each item can only be added once. This item can be any Zabbix item except for a binary item and depending on the item type the displayed information differs.