Services
Services list
Within this list, all services are displayed with their respective names. If a service has one or more child services, they can be revealed by clicking the arrow left to the service’s name.
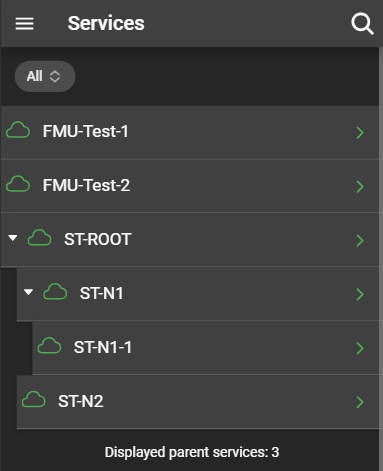
If no problems are present. the color of the cloud and arrow of the service is green. If there are problems present, the color will change to the color of the highest classified problem of that service.
Clicking on a service, whether it’s a parent or child service, opens the service details.
Filter services
You can apply various filters allowing you to focus on services with specific criteria.
Services with problems filter
This filter allows you to filter the services according to their state. There are three options:
- All: All services, regardless of the state are displayed.
- Services with problems: Only services with problems are displayed.
- Services in OK state: Only services in OK state are displayed.
Service details
Provides information about the service’s status, name, and additional details:
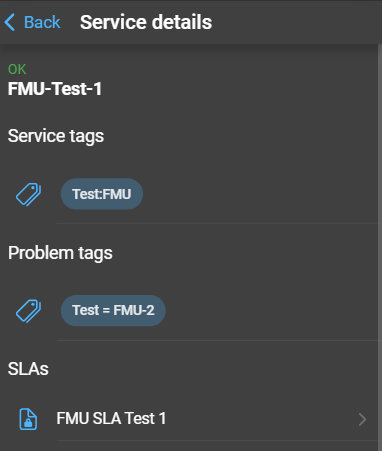
- Service Tags: Displays the service tags of the service.
- Problem Tags: Displays the problem tags of the service.
- SLAs: A list of SLAs the service is mapped with. Clicking on an SLA will show the SLA details.
Service uptimes
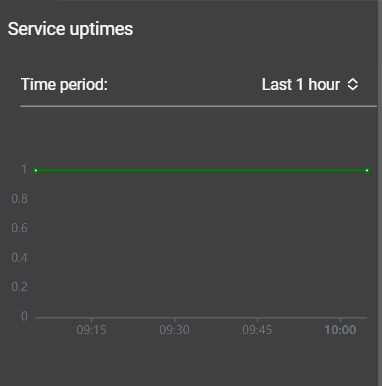
Displays the uptime of the service over a specified period of time. Users can select the time period from a dropdown. If the default options are insufficient, an option is available for specifying a custom time period. The graph displays the up- and downtime of the service for the selected time period. A service is considered up as long as it is in the OK state. This is shown in the graph with the value 1. Otherwise the service is considered to be down, represented in the graph by a 0.
SLAs
SLAs , or Service Level Agreements, are integral for monitoring services to ensure they meet their performance requirements. These requirements are defined as SLOs, or Service Level Objectives, and include aspects such as expected uptime and planned downtimes for a service. The dependency between services and SLAs is implemented using service tags, and a single SLA can be assigned to several services.
SLA details
SLAs do not have a dedicated page within DataForge but can be examined by navigating to the services page and inspecting a service details page (as explained in Service Details). You can inspect the SLA details, by clicking the corresponding SLA link.
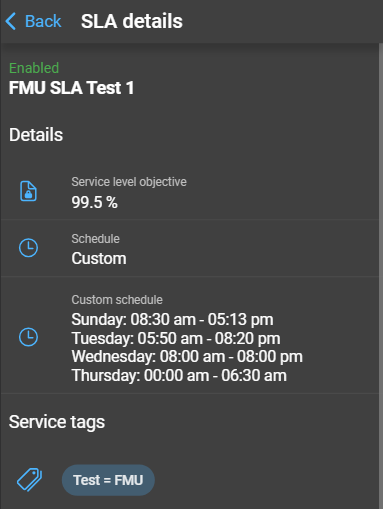
The details page of an SLA displays information about whether the SLA is enabled or not, followed by the name of the SLA. In the details section, you’ll find information about:
- SLO (Service Level Objective): Specifies the required uptime, excluding planned downtimes, for that service.
- Schedule type: Displayed as
Always(Zabbix’s24x7option) or a detailed schedule. - Service tags: Displays the service tags associated with the SLA.
- SLI (Service Level Indicator): representing the service availability in percentage presented as a graph in the SLI Details.
SLI details
The SLI (Service Level Indicator) provides insights into the amount of time a service remains in an OK state (uptime) or a Problem state (downtime). The graph illustrates these for the services covered by the SLA. Any excluded downtimes, specified in the SLA’s configuration, are not considered in this calculation.
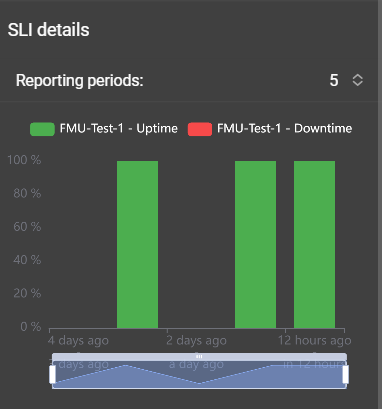
You can adjust the number of periods displayed using the Reporting periods dropdown menu. Hovering over the bars of the graph provides detailed information about each period, and the data zoom allows you to zoom in on specific time intervals.
A list of excluded downtimes can be found beneath the graph.
