Hosts
The hosts page provides an overview of the server’s available hosts in the form of a list. Each host is displayed as a card with two types of information: the name of the host and the state of the host. To access the host details page, click the arrow on the card.
State of the host
The state of each host is indicated by the color of the card header:
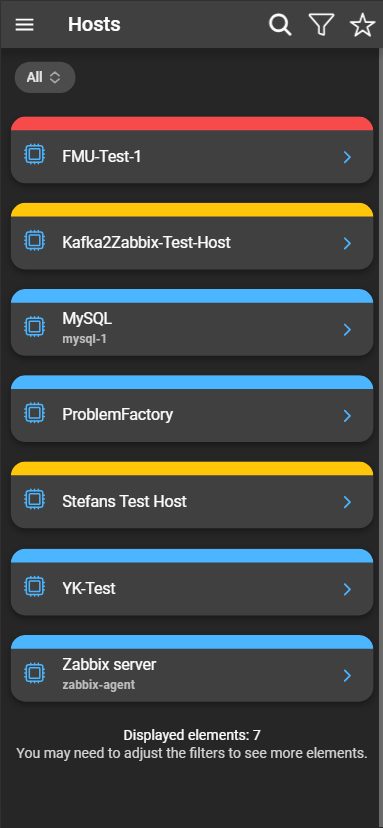
- Blue: The host is not in maintenance and is not disabled.
- Yellow: The host is in maintenance with data collection.
- Red: The host is in maintenance without data collection.
- Gray: The host is disabled.
For more information about the maintenance state, you can refer to the Zabbix documentation about maintenance .
Filter hosts
You can apply various filters or select favorites, allowing you to focus on hosts with specific criteria.
Advanced filters
Clicking the funnel icon opens a menu with advanced filtering and sorting options:

- Sort by: You can choose an identifier by which the elements are ordered.
- Sort order: Select between ascending or descending sorting, depending on the chosen identifier.
- Displayed Elements: Adjust the number of hosts shown in the list.
- Tags: Filter by tags. Can be expanded by clicking the plus. The tags filter configuration mirrors that of Zabbix.
To save your filter options, click Filter. If you wish to reset the filters to their default settings, use Reset Filters.
Host details
By clicking the arrow of a host card, the host details can be inspected. It provides various information:
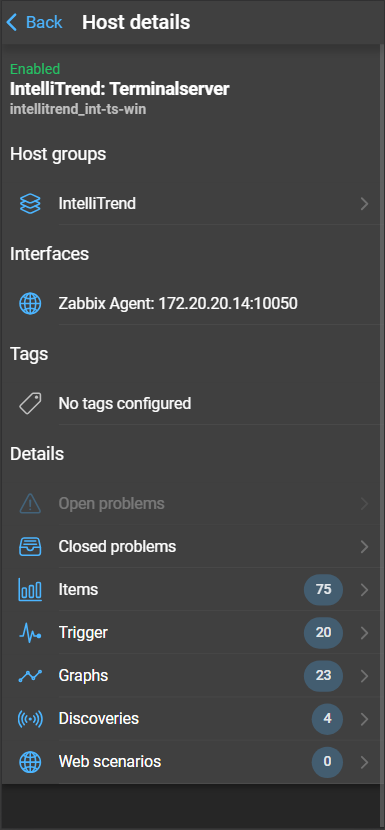
- Host Status: This section displays the current state of the host. If the host is currently in maintenance, this status will also be visible here.
- Visible Name: The visible name of the host is displayed as primary name.
- Host Name: The host name, as specified in the Zabbix configuration, is displayed as secondary name.
- Host description: The hosts description configured on the Zabbix server.
- Host groups: Displays the host groups to which the host belongs. Clicking it navigates to the host group page displaying the host groups the host is part of.
- Interfaces: Lists the interfaces of the host.
- Tags: Lists the configured tags of the host.
- Open Problems: Shows the number of open problems associated with the host. Clicking it navigates to the open problems page displaying the open problems of the host.
- Closed Problems: Clicking it opens the closed problems page displaying the closed problems of the host.
- Items: Indicates the number of items associated with the host. Clicking on it navigates to the items page displaying all items of the host.
- Trigger: Shows the number of triggers related to the host. Clicking it navigates to the triggers page displaying all triggers of the host.
- Graphs: Displays the number of graphs for the host. Clicking it navigates to the graphs page displaying all graphs of the host.
- Discoveries: Shows the number of discovery rules associated with the host. Clicking it expands the list.
- Web Scenarios: Indicates the number of web scenarios related to the host. Clicking it expands the list.