Dashboard
The dashboard’s content is categorized into sections to provide a structured overview. The first section of the dashboard is dedicated to displaying information from the Zabbix client. The second section focuses on Reporting and provides insights into report generation, distribution, and other reporting-related functionalities. The third section is related to Self Provisioning and presents information about host and host group maintenances, as well as alerts.
Every entity card offers a shortcut to the corresponding sections of the Zabbix Client with the relevant filters applied.
Zabbix Client
A comprehensive overview of data retrieved through the Zabbix Client section. It offers a quick and convenient way to access and monitor various aspects of your Zabbix server.
Zabbix server and version
At the top left corner of the dashboard, you’ll find information about your Zabbix server installation:
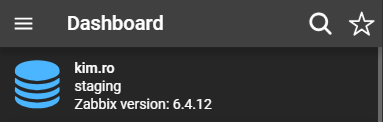
- User: The user you are logged in with.
- Server: Displays the server address. When loggin as a DataForge user, the server alias will be displayed.
- Zabbix version: The version of Zabbix that your server is running.
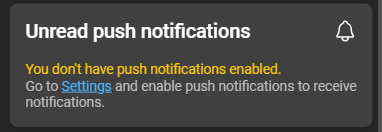
Push notifications
IntelliTrend Mobile for Zabbix offers a unique push notification service. A detailed guide on how to use this service can be found in its corresponding chapter push notifications. This push notification card list the last two unread push notification if enabled.
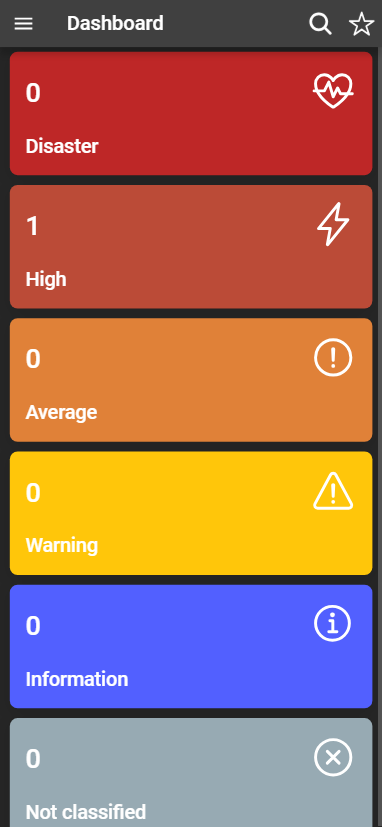
Problems overview
Offers an overview of all currently open problems detected on your Zabbix server. These are subdivided into six severity cards, displaying the count of currently open problems of each severity, except for suppressed problems.
Services
Service monitoring is focusing on the overall availability of a service. These states are depicted on two different cards: Services in OK state and Services with problems:
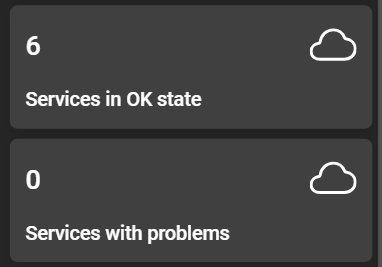
- Services in OK State: Represents the number of services that are currently in an
OKstate. - Services with Problems: Represents the number of services that are experiencing problems.
For more in-depth information on SLAs in Zabbix, you can refer to the official Zabbix documentation .
Host Groups, Hosts, Trigger and Items
Four cards that serve as a quick reference to the major components of your Zabbix monitoring environment and allow you to navigate to the corresponding sections.
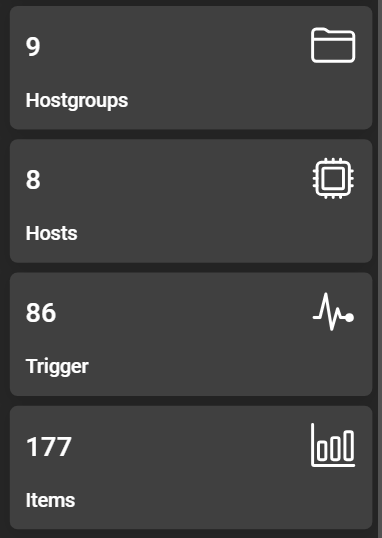
- Host Groups: Displays the total count of host groups in your Zabbix monitoring system.
- Hosts: Indicates the total number of hosts being monitored in your Zabbix environment.
- Triggers: Shows the total count of triggers that are set up in your Zabbix system.
- Items: Displays the total number of items defined in your Zabbix configuration.
Search and favorites
The Zabbix Client section can be filtered according to specific hosts and host groups.
- Open the search function by clicking the magnifying glass. It opens the hosts page and allows a quick way to filter for specific hosts.
- If favorites are applied only Zabbix Client elements of that host or host group will be displayed on the dashboard. Favorites can be accessed by clicking the star icon.
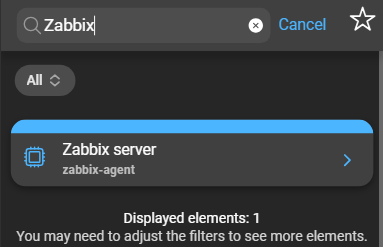
You can find more information in the dedicated chapter about filtering and favorites.
Reporting
Reporting consists of templates and reports. The reports can then be distributed and managed via subscriptions. Three cards represent these components of DataForge. Each of these cards provides a link to the configured entity.
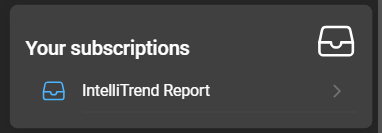
Your subscriptions
Displays a list of reports that you are currently subscribed to. Clicking on a subscription will navigate you to its settings page.
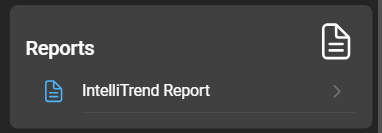
Reports
Shows a list of reports that have been created. By clicking on a report, you will be navigated to its configuration page.
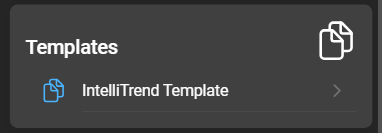
Templates
Lists the templates that have been created for generating reports. Clicking on a template will direct you to the templates configuration page.
Self Provisioning
The section of the dashboard provides an overview of the Self provisioning feature by displaying data related to maintenances and alerts. If maintenances or alerts are configured, they will be displayed in the list.
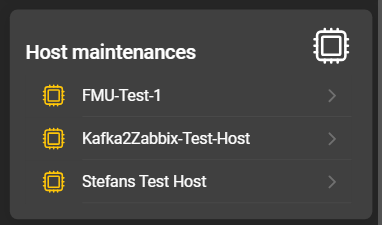
Host Maintenances
Clicking on an entry will open the host maintenance page in self provisioning with the corresponding filter applied. This allows you to manage the maintenance for that host.
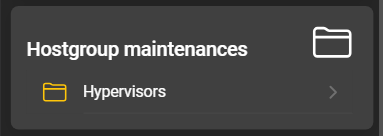
Host group Maintenances
Clicking on an entry will open the host group maintenance page in self provisioning with the corresponding filter applied. This enables you to manage the maintenance for that host group.
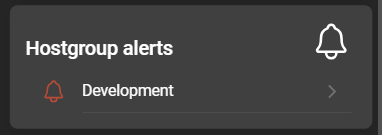
Host group Alerts
If you click on an entry, it will navigate you to the alerts page in self provisioning with the corresponding filter applied, allowing you to manage your alerts for that specific host group.
Colored icons
The colored icons of the entities in the self provisioning section provide additional information about the entity.
Maintenances
For maintenances there are three different colors:
- Green: The host or host group is not in maintenance.
- Yellow: The host or host group is in maintenance with data collection enabled.
- Red: The host or host group is in maintenance with data collection disabled.
Alerts
The icon color of alerts is reflects the color of the configured severity of the alert. If no alert is configured, the icon’s color is grey.