Introduction
IntelliTrend Mobile for Zabbix
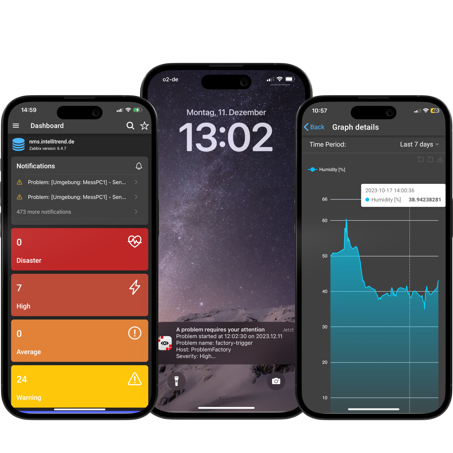
The IntelliTrend Mobile for Zabbix app provides a seamless mobile experience for monitoring Zabbix servers, allowing you to stay informed and responsive at all times.
If you don’t have the IntelliTrend Mobile for Zabbix app yet, you can get it here:
The app operates in two distinct modes: Zabbix-Direct and DataForge. This choice between modes is only available when using the app, as Zabbix-Direct is IntelliTrend Mobile for Zabbix exclusive, as well as our unique push notification service. The differences between both modes are explained in their respective chapters: Zabbix-Direct and DataForge. For a quick comparison between the two modes, refer to the table provided in this chapter.
Zabbix-Direct
Zabbix-Direct is primarily targeted at individual users who want to monitor their Zabbix server and receive push notification triggered by certain events. Zabbix-Direct is only accessible with the IntelliTrend Mobile for Zabbix app and directly communicates with your Zabbix server installation, more specifically with your Zabbix frontend, using the Zabbix-API over HTTP/HTTPS.

We provide a comprehensive dashboard and dedicated sections for all identified issues, configured triggers, host groups, hosts, items, graphs, and services. Zabbix-Direct not only allows you to inspect graphs generated by Zabbix, it also generates its own graphs and lists for numeric and text items. Its functionality mirrors that of DataForge’s Zabbix client.
The app can be downloaded for free and we offer a free trial period for Zabbix-Direct. After that, a subscription is required.
DataForge does not require a subscription but a valid DataForge account. This account can be used with the app and also the web based DataForge user portal.
DataForge
Expanding upon the capabilities of Zabbix-Direct, DataForge offers advanced components like Self provisioning and Reporting and the management of multiple different Zabbix servers.
The mobile app and the Dataforge web frontend communicate with the DataForge Server using HTTP/HTTPS, which in turn communicates with the respective Zabbix installation frontend using the Zabbix-API over HTTP/HTTPS.
 →
→
DataForge is designed for horizontal scalability, meaning it can efficiently manage multiple Zabbix servers and map larger sized company structures. This provides a view of organizational hierarchies and allows you to manage these with a role based authorization system.
So DataForge is well suited to work in environments of System integrators, MSPs, MaaS provider and large corporations running multiple independent Zabbix servers and provides easy access through a simple to use user portal and a mobile app.
Self provisioning
DataForge’s Self provisioning is defined by two key features: Maintenances and Alerts.
Maintenance: Allows you to set hosts or entire host groups into maintenance directly via the app. With hosts or host groups in maintenance mode, you further have the ability to decide if the host or host group in maintenance still collects data, or if data collection is suspended during the maintenance.
Alerts: Allows you to enable or disable alerts for specific host groups in response to configurable severity levels of problems. These alerts utilize the configured media types on the Zabbix server. Notably, users can even opt to receive push notifications on their mobile devices through our IntelliTrend Mobile for Zabbix app.
Reporting
Another distinctive feature is the capability to configure, generate, and receive reports. These reports are created from customizable templates using widgets and can visualize various data from your Zabbix server. Within the report configuration, there is a scheduling mode that determines the frequency at which the report is generated and dispatched. To receive these reports, you must subscribe to them and select the format in which the report is generated. Available options include PDF, JSON, XML, and CSV.
Comparison table
- Available in app
- Available in browser
| Zabbix-Direct | DataForge | |
|---|---|---|
| Receive push notifications | ||
| View dashboard | / | |
| View Open Problems | / | |
| View Closed Problems | / | |
| Change acknowldgement of problems | / | |
| View configured triggers | / | |
| View host groups | / | |
| View hosts | / | |
| View configured items | / | |
| View DataForge item history graphs and tables | / | |
| View configured Zabbix graphs | / | |
| View service details | / | |
| View service uptime graphs | / | |
| View SLA details | / | |
| View SLA uptime graphs | / | |
| Configure favorite filters for Zabbix Client | / | |
| Configure maintenances for host groups | – | / |
| Configure maintenances for hosts | – | / |
| Configure alerts for host groups | – | / |
| Create AI datasets based on your Zabbix data | – | / |
| Create AI models for anomaly detection | – | / |
| Receive calculated item data via your AI model | – | / |
| Create report templates | – | / |
| Create and configure report templates | – | / |
| Create and configure reports | – | / |
| View report jobs | – | / |
| Monitor DataForge microservices | – | / |
| View DataForge microservice's netlog | – | / |
| View Auditlog | – | / |
Where to begin?
Depending on the product and user type you are using, there are multiple valid entry points. The following list takes you to the relevant chapters, which you can use as an introduction.
| Type | Chapter | Description |
|---|---|---|
| Zabbix-Direct user | Zabbix-Direct | Offers references to the features of Zabbix direct and push notifications. |
| DataForge user | User manual: Getting started | Describes how to add an account for DataForge users and offers a step by step guide for working with DataForge. This guide references:
|
| DataForge manager | Manager manual: Getting started | Describes how to add an account for DataForge managers and offers a step by step guide for managing DataForge. This guide references the creation of:
|