Hosts
The hosts page provides an overview of the server’s available hosts in the form of a list. Each host is displayed as a card with two types of information: the host name and the host state. To access the host details page, click the arrow on the card.
Host state
The color of the card header indicates the state of the host:
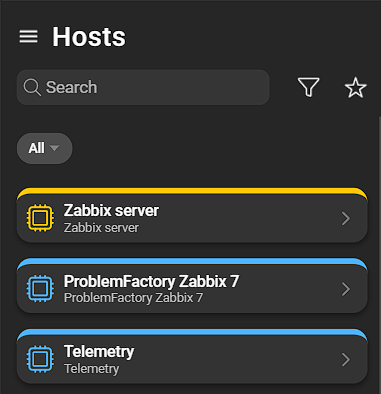
- Blue: The host is not in maintenance and is not disabled.
- Yellow: The host is in maintenance with data collection.
- Red: The host is in maintenance without data collection.
- Gray: The host is disabled.
Filtering hosts
Various filters or favorites can be applied to focus on hosts matching specific criteria.
Advanced filters
Clicking the funnel icon opens a menu with advanced filtering and sorting options:
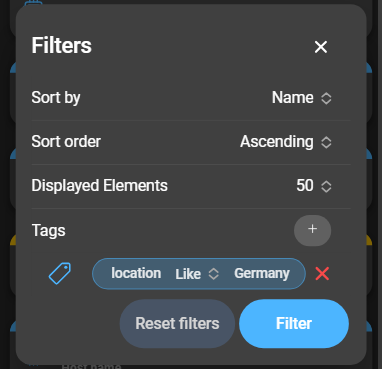
- Sort by: Identifier by which the hosts are ordered.
- Sort order: Whether the hosts are sorted in ascending or descending order.
- Displayed elements: Total number of hosts shown in the list.
- Tags: Filter by tags. Can be expanded by clicking the plus. The tag filter configuration mirrors that of Zabbix.
Click Filter to save and apply filter options. Use Reset Filters to restore the defaults.
Host details
Clicking the arrow of a host card opens the host details. This section provides the following information:
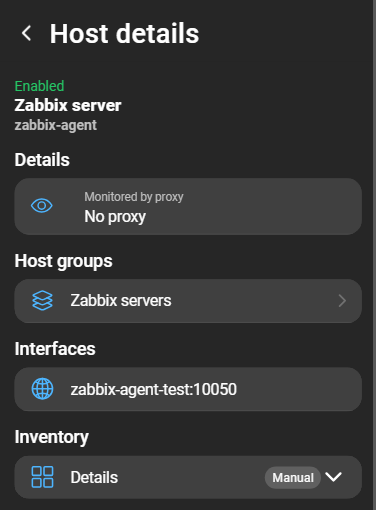
- Host status: The current state of the host. If the host is in maintenance, this status is also visible here.
- Visible name: The visible name of the host, displayed as primary name.
- Host name: The host name specified in the Zabbix configuration, displayed as secondary name.
- Host description: The description configured on the Zabbix server.
- Monitored by proxy: The proxy monitoring the host.
- Host groups: The host groups to which the host belongs. Clicking navigates to the host groups page.
- Interfaces: List of the host’s interfaces.
- Inventory: The inventory building mode. Can be expanded to view the host’s inventory.
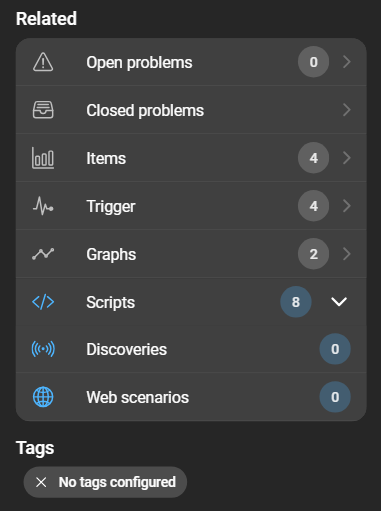
- Open problems: The number of open problems associated with the host. Clicking navigates to the open problems page to display the host’s open problems.
- Closed problems: Opens the closed problems page to display the host’s closed problems.
- Items: The number of items associated with the host. Clicking opens the items page, listing all items of the host.
- Triggers: The number of triggers related to the host. Clicking opens the triggers page.
- Graphs: The number of graphs for the host. Clicking opens the graphs page.
- Scripts: An expandable list of all host scripts. These can be executed, and responses can be viewed.
- Discoveries: The number of discovery rules associated with the host. Clicking expands the list.
- Web scenarios: The number of web scenarios related to the host. Clicking expands the list.
- Tags: Shows related tag names and values of the host.
Scripts
Within host details, the Scripts section shows the number of host scripts. Clicking expands the section to display a list of all host scripts:
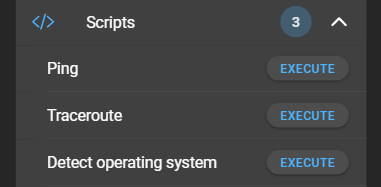
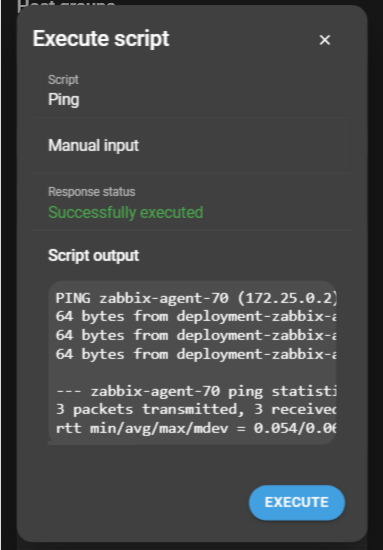
Click Execute to open a modal:
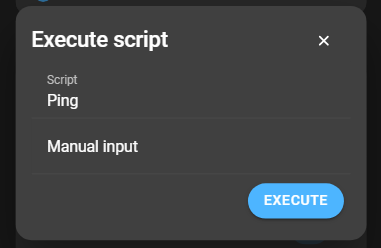
In addition to the script name, a Manual input field is available. This field is optional and only supported since Zabbix 7.0.
For more information about Zabbix scripts, refer to the chapter scripts in the Zabbix documentation.
Click Execute to run the script. The result (response status and script output) is then displayed: