Graphs
Graph list
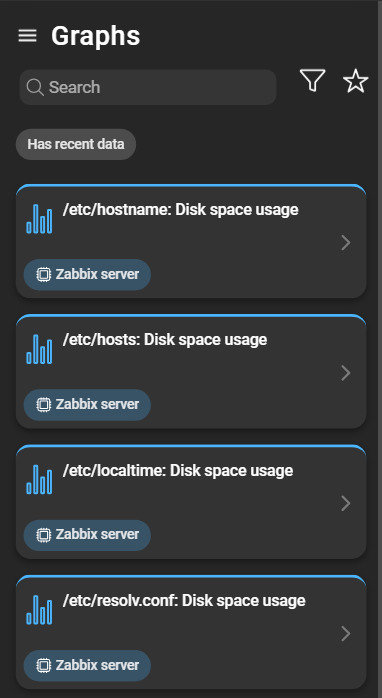
The list presents an overview of all graphs provided by the Zabbix server. Each entry is represented by its graph name and the host from which the graph originates. The entries can be filtered, and clicking an entry opens the graph details page.
Filtering graphs
Various filters or favorites can be applied to focus on graphs matching specific criteria.
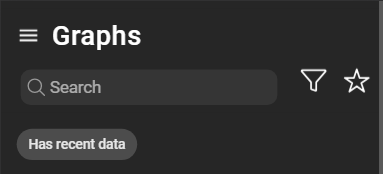
Has recent data filter
The Has recent data filter can be toggled. When enabled, it hides graphs that consist solely of items with no recent data.
Advanced filters
Clicking the funnel icon opens a menu with advanced filtering and sorting options:
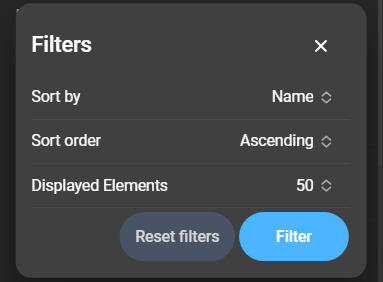
- Sort by: Identifier by which the elements are ordered.
- Sort order: Whether the elements are sorted in ascending or descending order.
- Displayed elements: Total number of graphs shown in the list.
Click Filter to save and apply filter options. Use Reset filters to restore the defaults.
Graph details
Graph details can be accessed by clicking a graph entry from the list. The top section of this page consists of the following:
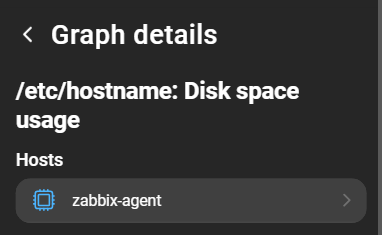
- Name: The name of the graph imported from Zabbix.
- Hosts: The hosts associated with the graph. Clicking opens the host details page.
Graph
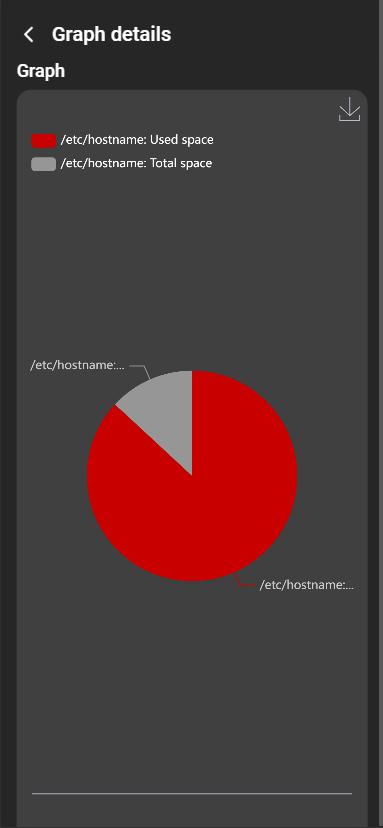
Depending on the Zabbix graphs settings, one of four types of graphs is displayed. The first graph has all available options, while some sections of the second graph are limited by the graph type:
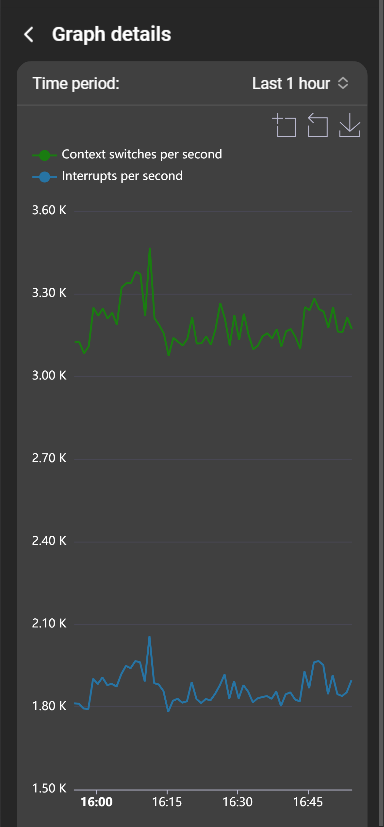
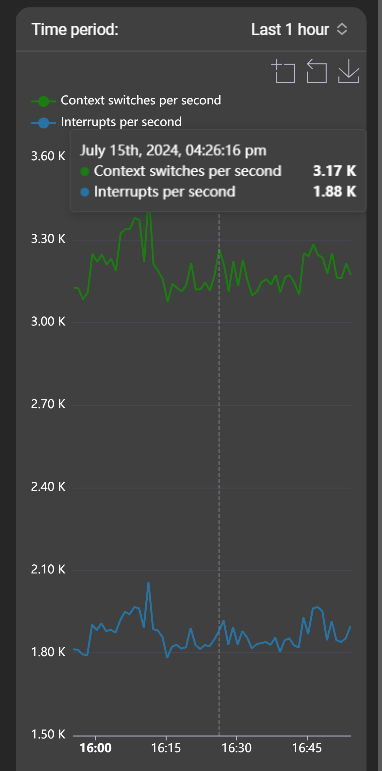
- Time period: Configure and specify a time range. Only values of the items within that range are displayed on the graph.
- General graph actions: Options for zooming, resetting the zoom, and saving the graph as an image.
- Legend: Describes the different items represented on the graph. When multiple items are depicted, data collections can be enabled or disabled by clicking the legend entry. Disabled data collections are not rendered within the graph.
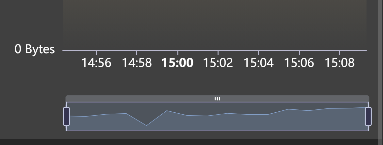
The data zoom function can be used to select a specific period and zoom in on it:
Hovering the mouse over a data point on the graph displays an info box with additional details: