SLA
Fetches data from services and SLAs of a Zabbix server.

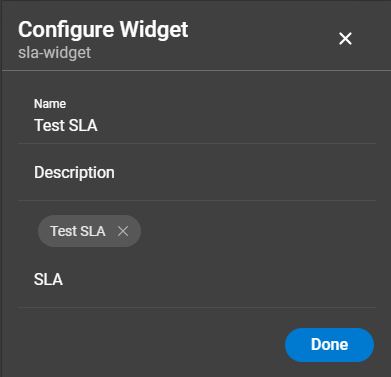
- SLA: Choose the SLA to be displayed in the report.
Render examples
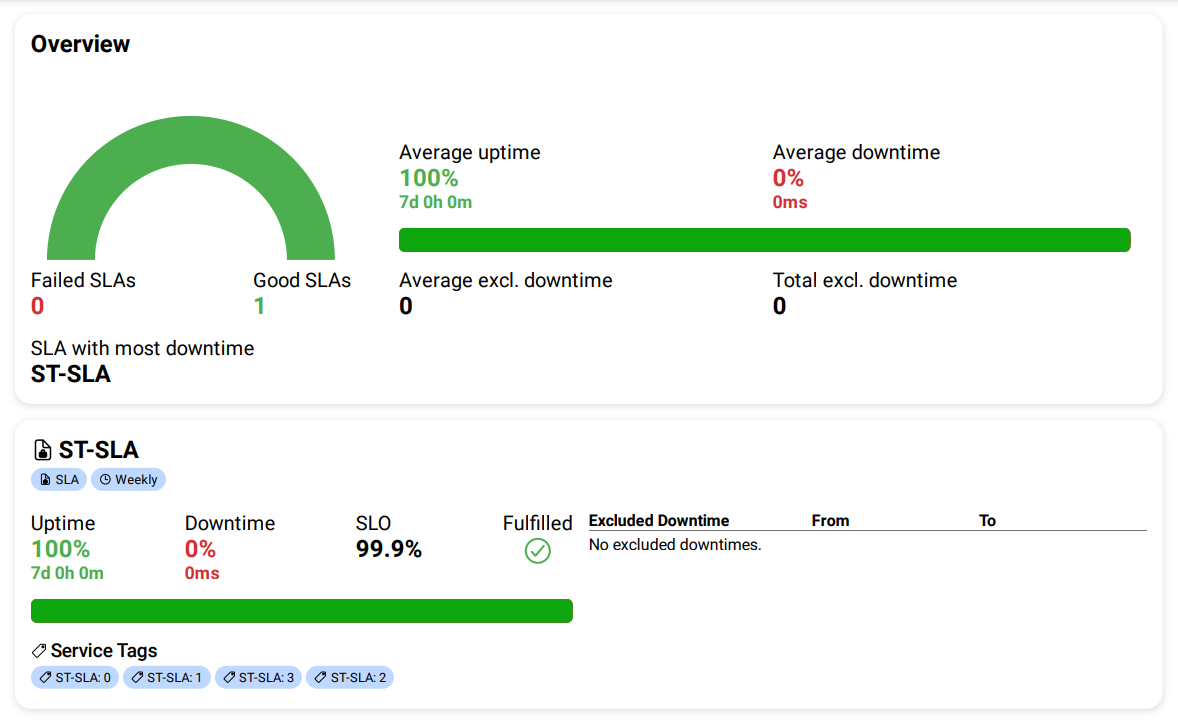
Displays an overview about all SLAs and detailed information for each selected SLA.

Overview
- A visualization and count of failed to good SLAs,
- the average up- and downtime value and visualization of all SLAs,
- the average and total excluded downtime
SLA
- The name of the SLA with configured reporting period,
- the up- and downtime with visualization,
- the configured SLO and fulfillment indicator,
- the configured service tags,
- a list of excluded downtimes.
This JSON is shortened and shows no redundant data.
{
	"displayName": "ST-SLA",
	"name": "sla-widget",
	"description": "SLA for testing.",
	"version": "1.0.0",
	"error": "",
	"sla": [
		{
			"name": "ST-SLA",
			"id": 3,
			"description": "",
			"timezone": "system",
			"goodSLA": 99.9,
			"failed": false,
			"start": 1732402800,
			"end": 1733007600,
			"totalUptime": 100,
			"totalUptimeSeconds": 604800,
			"totalDowntimeSeconds": 0,
			"totalDowntime": 0,
			"period": 1,
			"excludedDowntimes": null,
			"ServiceTags": [
				{
					"tag": "ST-SLA",
					"operator": 0,
					"value": "0"
				}
			],
			"services": [
				{
					"algorithm": 2,
					"created_at": 1707997198,
					"name": "ST-ROOT",
					"propagation_rule": 0,
					"propagation_value": 0,
					"serviceid": "3",
					"sortorder": 0,
					"status": -1,
					"status_timeline": [
						{
							"start_value": -1
						}
					],
					"tags": [
						{
							"tag": "ST-SLA",
							"value": "0"
						}
					],
					"uuid": "bc0f67f6e6f246db9958434f44517da8",
					"weight": 0
				}
			]
		}
	]
}