Problem
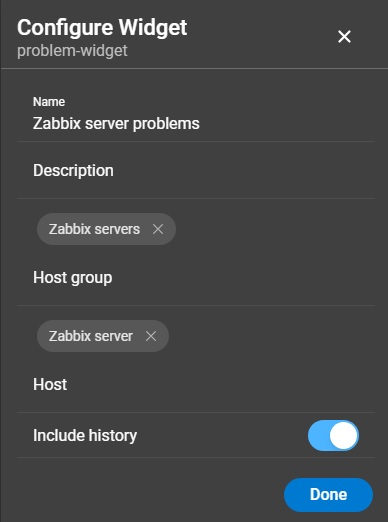
The configuration of a Problem widget offers the following options (aside from the general settings of a widget):

- Host group: Select one or more the host groups for which problems will be included in the report.
- Host: Select one or more the hosts for which problems will be included in the report.
- Include History: When toggled on, problems that arose and were closed within the specified time period are also shown.
Render examples
A detailed summary of problems of selected hosts and host groups.
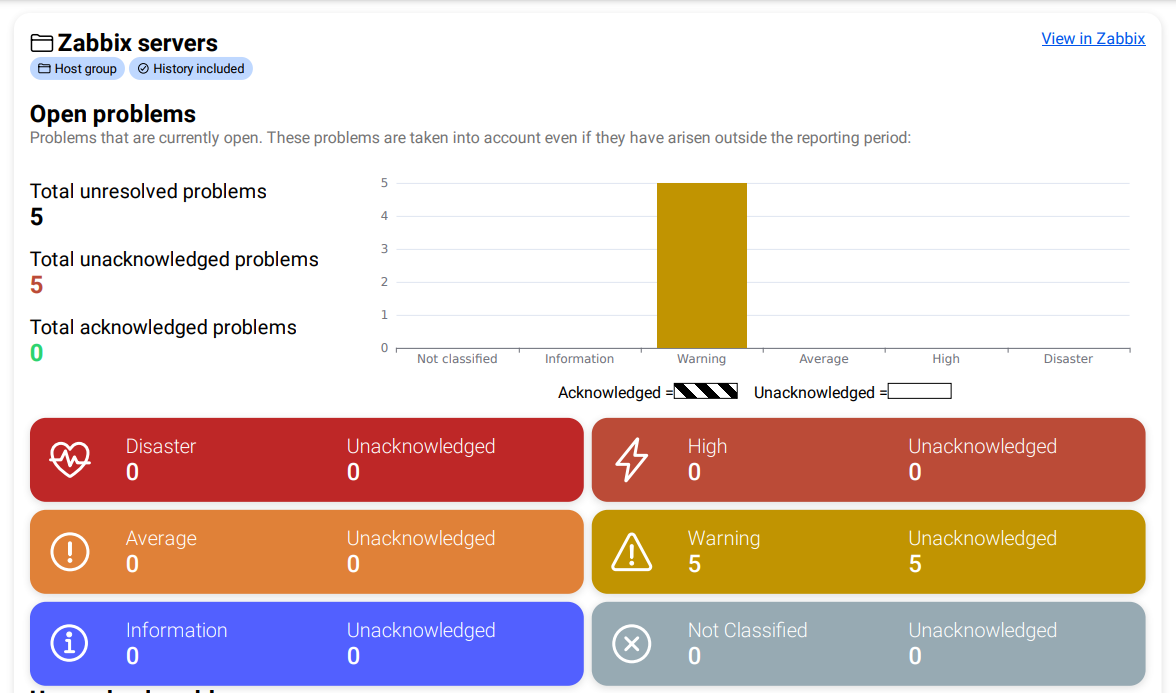
Open Problems

- A total problem count including a breakdown of acknowledged and unacknowledged problems,
- a bar-chart visualizing the severity distribution of open problems including acknowledgments,
- a number of problems per severity, including how many of these are unacknowledged.
Unresolved problems list

A list of problems, sorted by time of occurrence in descending order. This list contains relevant information about the problem, such as the duration, how long the problem was open, the event ID with a link to view the problem in Zabbix, the number of alerts, etc.
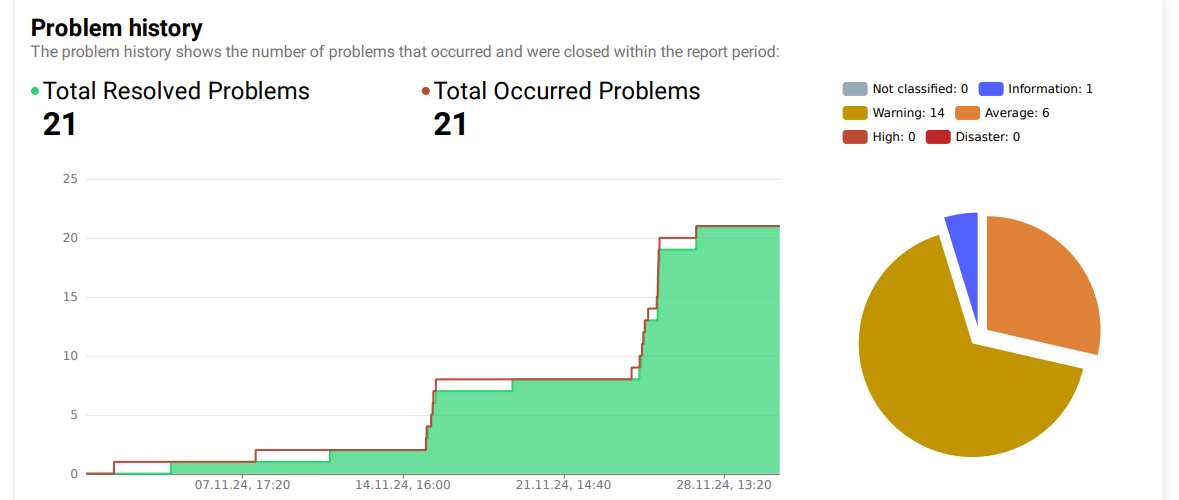
Problem history

- A line-chart visualizing when problems opened and were closed,
- a pie-chart showing the distribution of the resolved problems.
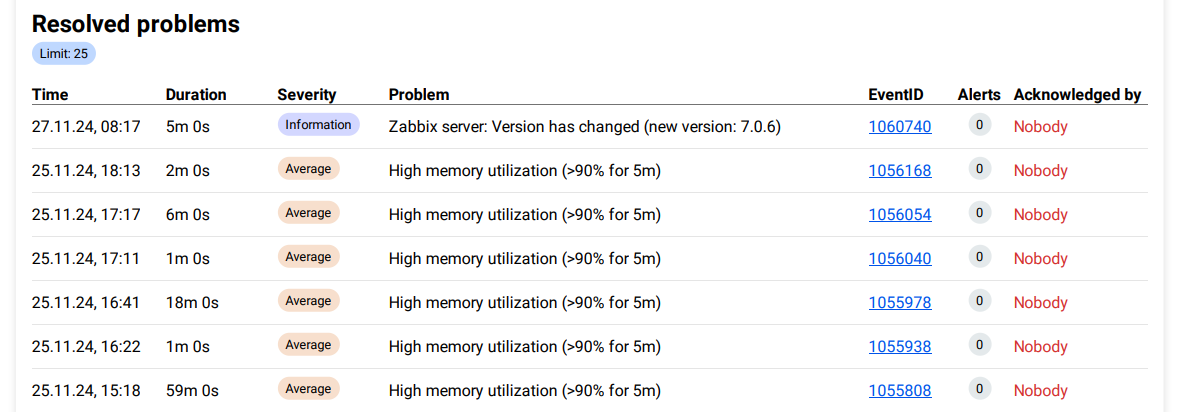
Resolved problems
A list of problems, sorted by time of occurrence in descending order. This list contains relevant information about the problem, such as the duration, how long the problem has been open, the event ID with a link to view the problem in Zabbix, the number of alerts, etc.

This JSON is shortened and shows no redundant data.
{
	"displayName": "Zabbix servers problems",
	"name": "problem-widget",
	"description": "Problems of Zabbix server, including history.",
	"version": "1.0.0",
	"error": "",
	"problemCount": 26,
	"hostGroups": [
		{
			"hostgroup": {
				"flags": 0,
				"groupid": "4",
				"name": "Zabbix servers",
				"uuid": "6f6799aa69e844b4b3918f779f2abf08"
			},
			"currentProblems": {
				"notClassified": 0,
				"information": 0,
				"warning": 5,
				"average": 0,
				"high": 0,
				"disaster": 0,
				"list": [
					{
						"problem": {
							"acknowledged": 0,
							"clock": 1729848572,
							"eventid": "965791",
							"name": "/etc/localtime: Disk space is low (used \u003e 80%)",
							"ns": 90739280,
							"object": 0,
							"objectid": "23109",
							"opdata": "Space used: 32.52 GB of 39.07 GB (87.7609 %)",
							"r_clock": 0,
							"r_ns": 0,
							"severity": 2,
							"source": 0,
							"suppressed": 0,
							"tags": [
								{
									"tag": "Location",
									"value": "Germany"
								},
								{
									"tag": "class",
									"value": "os"
								},
								{
									"tag": "component",
									"value": "storage"
								},
								{
									"tag": "filesystem",
									"value": "/etc/localtime"
								},
								{
									"tag": "scope",
									"value": "availability"
								},
								{
									"tag": "scope",
									"value": "capacity"
								},
								{
									"tag": "target",
									"value": "linux"
								}
							]
						},
						"acknowledged": false,
						"acknowledged_by": "",
						"alerts": [
							{
								"actionid": "3",
								"alertid": "1061334",
								"alerttype": 0,
								"clock": 1729848572,
								"error": "Sending failed: error: invalid credentials",
								"esc_step": 1,
								"mediatypeid": "34",
								"message": "Trigger: /etc/localtime: Disk space is low (used \u003e 80%)\r\nTrigger status: PROBLEM\r\nTrigger severity: Warning\r\nTime: 09:29:32\r\n\r\nItem values:\r\n1. /etc/localtime: Space utilization (Zabbix server:vfs.fs.size[/etc/localtime,pused]): 80.55 %\r\n\r\nDescription:\r\nTwo conditions should match:\r\n 1. The first condition - utilization of space should be above 90.\r\n 2. The second condition should be one of the following:\r\n  - the disk free space is less than 10G;\r\n  - the disk will be full in less than 24 hours.",
								"retries": 1,
								"sendto": "{\"accountId\":\"dfu-irs.intellitrend.destaging eric.goldschmidt\",\"ppi\":\"6OFA1W7CJC032ZS6\",\"server\":\"irs.intellitrend.de\",\"serverAlias\":\"staging\",\"username\":\"eric.goldschmidt\",\"deviceModel\":\"SM-A528B\",\"deviceName\":\"A52s von Eric\"}",
								"status": 2,
								"subject": "Warning: PROBLEM: /etc/localtime: Disk space is low (used \u003e 80%)",
								"userid": "160"
							}
						]
					}
				]
			},
			"includeHistory": true,
			"problemHistory": {
				"notClassified": 0,
				"information": 1,
				"warning": 14,
				"average": 6,
				"high": 0,
				"disaster": 0,
				"list": [
					{
						"problem": {
							"acknowledged": 0,
							"alerts": [
								{
									"actionid": "3",
									"alertid": "1229149",
									"alerttype": 0,
									"clock": 1730519636,
									"error": "Sending failed: error: invalid credentials",
									"esc_step": 1,
									"mediatypeid": "34",
									"message": "Trigger: High swap space usage (less than 50% free)\r\nTrigger status: PROBLEM\r\nTrigger severity: Warning\r\nTime: 03:53:56\r\n\r\nItem values:\r\n1. Free swap space in % (Zabbix server:system.swap.size[,pfree]): 49 %\r\n\r\nDescription:\r\nIf there is no swap configured, this trigger is ignored.",
									"retries": 1,
									"sendto": "{\"accountId\":\"dfu-irs.intellitrend.destaging eric.goldschmidt\",\"ppi\":\"6OFA1W7CJC032ZS6\",\"server\":\"irs.intellitrend.de\",\"serverAlias\":\"staging\",\"username\":\"eric.goldschmidt\",\"deviceModel\":\"SM-A528B\",\"deviceName\":\"A52s von Eric\"}",
									"status": 2,
									"subject": "Warning: PROBLEM: High swap space usage (less than 50% free)",
									"userid": "160"
								}
							],
							"clock": 1730519636,
							"eventid": "988166",
							"name": "High swap space usage (less than 50% free)",
							"ns": 90061844,
							"object": 0,
							"objectid": "22393",
							"opdata": "Free: 55.6552 %, total: 3.83 GB",
							"r_eventid": "995247",
							"severity": 2,
							"source": 0,
							"suppressed": 0,
							"value": 1
						},
						"recoveryTime": 1730732036
					}
				]
			}
		}
	],
	"hosts": []
}