Reports
PDF, JSON, CSV, XML and Protocol Buffers.Overview
A DataForge report is a structured document that collects, processes, and presents data of your Zabbix server in a meaningful way, helping users analyze and interpret key information.
A report can be built using widgets and is periodically generated and automatically sent to all subscribers via their configured media types.
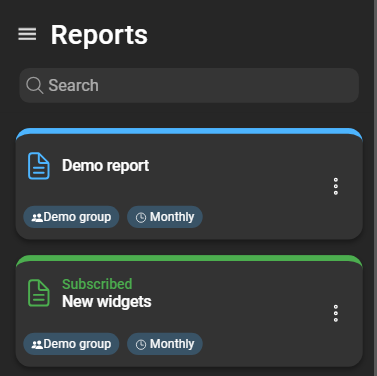
A card displays the selected DataForge user group for the report and the configured schedule. There are also two states in which a report card can be:
- Blue header and icons: You are not subscribed to this report.
- Green header and icons: You are subscribed to this report.
Create a new report
To create a new report, you must be logged in as (or impersonate) a DataForge user with the requisite permissions. Navigate to Reporting > Reports and click the blue plus button in the bottom right corner:
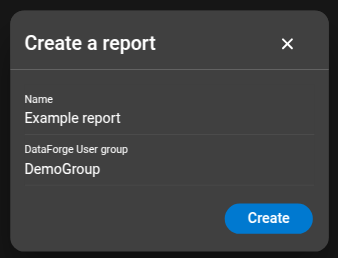
- Name: Specify the name of the report.
- DataForge User group: Choose a DataForge user group, which defines the accessible data from Zabbix.
After completing the form, click Create.
Report configuration
General
In the General section of the report configuration, you can change basic attributes like the Name, Short Description, and Long Description.
The Long Description is meant to be for longer information texts or explanations for this report. This description is only included in the rendered report document, for example on the cover page of the PDF report.
Scheduling
In the the Scheduling section of the report configuration, you can configure the Schedule Mode of this report. The Schedule Mode defines the automatic rendering
interval. When choosing Daily, you can additionally choose the exact time when the report should be rendered. For Weekly, the report is always rendered at 00:00 (server time) of the chosen weekday.
All other scheduling modes will be rendered at the following times:
- Hourly: At minute 0 of every hour.
- Monthly: At 00:00 on the first day of a month.
- Quarterly: At 00:00 on the first day of a quarter.
- Yearly: At 00:00 on the first day of a year.
PDF rendering options
Specifically for the rendered PDF report, you have the following options:
- Include table of contents page: When disabled, the PDF report will not render the table of contents page.
- Problems limit: The maximum number of problems that should be rendered in a problem lists. For any graph or statistically calculated value, all problems will be used. This option does only limit the rendered problems in a list.
- Text items limit: The maximum number of text item values that should be rendered in a text-item value list. For any statistically calculated value, all values will be used. This option does only limit the rendered text-item values in a list.
Widgets
In the Widgets section, you can create, configure, delete and re-order widgets. Widgets define the structure and data of a report. You must at least add one widget in order to render a report.
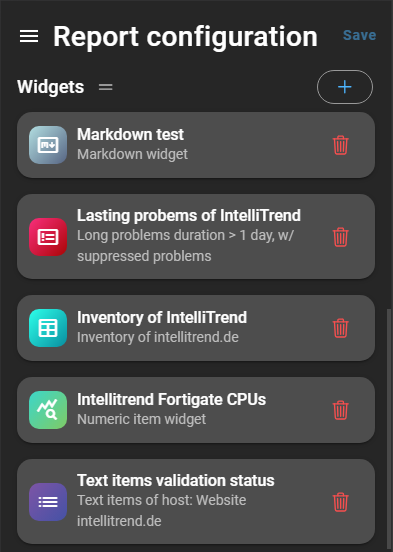
More information about and which data the various widgets can retrieve is covered in the Widgets chapter.
Reports
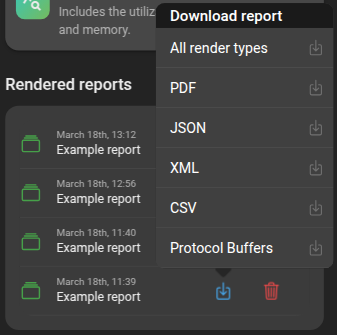
In the Reports section, you can view, delete and download rendered reports.
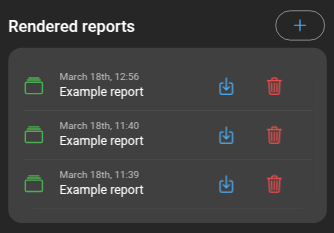
Also, you have the option to manually render a report. That way you can generate a new report without having to wait for the next periodically rendered report.
Click on the + Button above the list to open the Render now dialog. In that dialog you have the following rendering options:
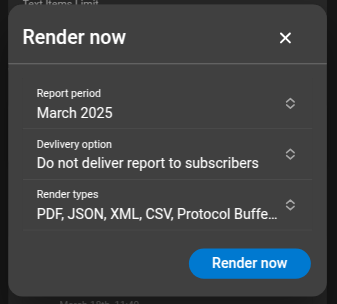
- Report period: The time frame you want to generate a report for.
- Delivery option:
- Deliver only to me: Will only deliver the report to yourself. This requires you to be subscribed to the report.
- Deliver to all subscribers: Will deliver the report to all subscribers of this report.
- Do not deliver report to subscribers: Will not deliver the report to any subscribers. This generated report is only available through downloading it.
- Render types: When choosing Do not deliver report to subscribers, you can specify what render types you want to be generated. Otherwise, the report will render all render types that were selected in the subscriptions.
When then clicking Render now, a new Report is being created. To see more details about the report, you can navigate to the Report details page by clicking the report.
Here you can see the report configuration of this report, as well as the PDF rendering options.
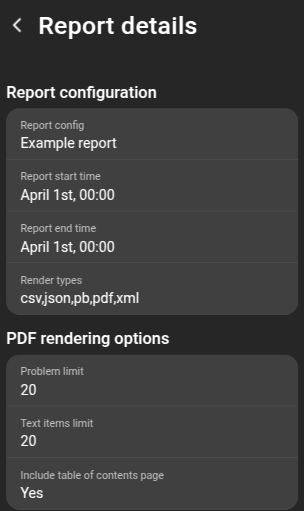
The Report configuration includes the Report config name, Report start time, Report end time and Render types the report was rendered for.
For the PDF rendering options you can see the configured Problem limit and Text item limit as well as whether the table of contents page was included or not.
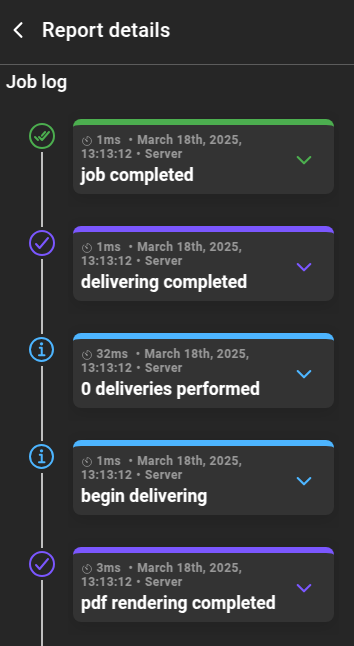
Below you can see the event log of the report job, including any warnings or errors the job had:
Once the report has been successfully rendered, you can download it at any time by clicking the download button in the report list:
JSON-Transformers
In the JSON-Transformers section, you can view, create, configure, delete and re-order.
Learn more about JSON-Transformers in the JSON-Transformers chapter.
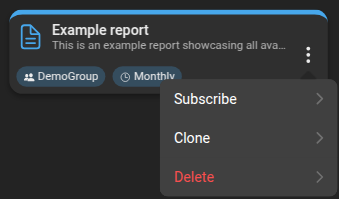
Clone reports
Reports can be created by cloning an existing report. To clone a report, access the context menu of the report and select Clone.
The new report requires a name, and to complete the cloning process, click Clone. Afterward, the cloned report will appear in the list.
Delete reports
To delete a report, open the context menu and select delete. DataForge will prompt you to confirm your decision before proceeding with the deletion. Once confirmed, the report disappears from the list and is deleted.