Introduction
Zabbix Direct, which is available exclusively through IntelliTrend Mobile, enables direct access to your Zabbix server from mobile devices. This solution is ideal for individual users or smaller organizations with single-server monitoring needs.
DataForge is a more comprehensive server solution, primarily designed for larger organizations with complex monitoring requirements. It enhances Zabbix with enterprise-grade features while incorporating all Zabbix Direct functionality. Accessible via both the IntelliTrend Mobile app and web browsers, it supports connecting to multiple Zabbix servers simultaneously.
IntelliTrend Mobile for Zabbix
IntelliTrend Mobile provides a smooth mobile experience for monitoring your Zabbix servers, allowing continuous awareness of your monitoring environment and rapid response capabilities.
If you haven’t installed the app yet, you can download it from the following stores:
The app operates in two distinct modes: Zabbix Direct and DataForge. This choice between modes is only available when using the app, as Zabbix Direct is IntelliTrend Mobile for Zabbix exclusive, as well as our unique push notification service. The differences between both modes are explained in their respective chapters: Zabbix Direct and DataForge. For a quick comparison between the two modes, refer to the table provided in this chapter.
Zabbix Direct
Zabbix Direct is designed for individual users seeking to monitor their Zabbix server and receive push notifications for specific events. It communicates directly with a Zabbix server’s frontend using the Zabbix API over HTTP/HTTPS, and is accessible exclusively through the IntelliTrend Mobile app for Zabbix.

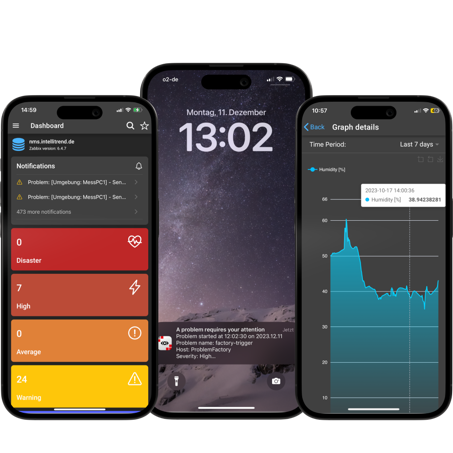
The solution features a comprehensive dashboard and dedicated sections for monitoring issues, configured triggers, host groups, hosts, items, graphs, and services. In addition to displaying Zabbix-generated graphs, Zabbix Direct creates custom visualizations and lists for both numeric and text items. This functionality parallels that of DataForge’s Zabbix Client.
The app can be downloaded for free and offers a free trial period for Zabbix Direct. Past the trial period, a subscription is required.
DataForge
Expanding upon the capabilities of Zabbix Direct, DataForge offers advanced functionality like reporting capabilities, Self Provisioning features and anomaly detection with DataForge AI. It includes role-based access control and allows management of multiple different Zabbix servers.
The mobile app and the DataForge web frontend communicate with the DataForge Server via HTTP/HTTPS. The DataForge Server in turn communicates with the respective Zabbix frontend using the Zabbix-API over HTTP/HTTPS.
 →
→
DataForge is designed to be horizontally scalable, enabling efficient management of multiple Zabbix servers and complex organizational structures. It offers comprehensive visualization of organizational hierarchies with a robust role-based authorization system for effective user management. The solution is accessed easily through an intuitive user portal and mobile application. This makes DataForge particularly well-suited for system integrators, MSPs, MaaS providers, and large corporations operating multiple independent Zabbix servers.
While DataForge doesn’t require a subscription, a valid DataForge account is necessary for usage. This account can be used with the IntelliTrend Mobile app and also the web based DataForge user portal.
Self Provisioning
DataForge Self Provisioning is defined by two key features: Maintenances and Alerts.
Maintenance: Allows to put single hosts or entire host groups into maintenance directly via the app. Hosts and host groups in maintenance mode can further be configured to continue collecting data, or to suspend data collection during the maintenances.
Alerts: Provides options to enable or disable alerts for specific host groups in response to configurable severity levels of problems. These alerts utilize the media types configured on the Zabbix server. Notably, users can opt to receive push notifications on their mobile devices through IntelliTrend Mobile.
AI
DataForge AI enables training and using artificial intelligence models for anomaly detection. These models are trained on multivariate time series data from item histories of a Zabbix server. Datasets can be extracted from a Zabbix server’s history and AI models trained to be tailored to the hosts that training-data was derived from. IntelliTrend’s AI Server is able to process new values from Zabbix servers in real time, executing models as soon as the data arrives and sending metrics about loss back to Zabbix. The received data can further be processed using regular actions and triggers to alert users about detected anomalies. In combination with the push notification service, users can be alerted about these anomalies directly on their mobile device.
Reporting
Another distinctive feature of DataForge is the capability to configure, generate, and receive reports. Reports are created by utilizing widgets to visualize various data from a Zabbix server. Reports generation and dispatch can be scheduled to automatically occur at regular intervals. For users to receive reports, a subscription to the desired reports is required and the format in which reports are generated can be selected. Available options include PDF, JSON, XML, and CSV.
Comparison table
- Available in app
- Available in browser
| Zabbix Direct | DataForge | |
|---|---|---|
| Receive push notifications | ||
| Manage dashboards | / | |
| Configure dashboards | / | |
| Inspect Open Problems | / | |
| Inspect Closed Problems | / | |
| Change acknowledgement of problems | / | |
| Inspect configured triggers | / | |
| Inspect host groups | / | |
| Inspect hosts | / | |
| Inspect configured items | / | |
| Inspect DataForge item history graphs and tables | / | |
| Inspect configured Zabbix graphs | / | |
| Inspect services | / | |
| Track service uptime | / | |
| Inspect SLA details | / | |
| Track SLA uptime | / | |
| Configure favorites and filters for Zabbix Client | / | |
| Configure maintenances for host groups | – | / |
| Configure maintenances for hosts | – | / |
| Configure alerts for host groups | – | / |
| Create AI datasets based on your Zabbix data | – | / |
| Create AI models for anomaly detection | – | / |
| Receive calculated item data via your AI model | – | / |
| Create and configure reports | – | / |
| Receive reports on a schedule or download on demand | – | / |
| View report jobs | – | / |
| Monitor DataForge microservices | – | / |
| View DataForge microservice netlog | – | / |
| View auditlog | – | / |
Where to begin?
There are multiple valid entry points, depending on the product and user type in question.
Users who have not yet completed setting up their Zabbix server in DataForge should refer to the DataForge manager manual to get started with DataForge.
Users who have finished setting up their Zabbix server in DataForge and/or simply want to get started with DataForge user features like Self Provisioning, Reporting or DataForge AI, can refer to the DataForge user manual.
For those who are looking to install an On-Premises DataForge instance, please refer to the DataForge Admin manual: Installation.
Additional details can be found in the table below:
| Type | Chapter | Description |
|---|---|---|
| Zabbix Direct | IntelliTrend Mobile for Zabbix: Zabbix Direct | Documentation for Zabbix Direct users of the IntelliTrend Mobile app for Zabbix. Includes references to the Zabbix Client and documentation about push notifications |
| DataForge user | DataForge User manual: Getting started | Documentation for DataForge users. It includes documentation to all DataForge user features such as:
|
| DataForge manager | DataForge Manager manual: Getting started | Documentation for DataForge managers. It includes documentation about DataForge manager features such as:
|
| DataForge admin | DataForge Admin manual | Documentation for DataForge instance administrators, which covers the following topics:
|