Busy triggers
Returns a list of triggers from a host group, that exceeded a specified amount of activations.
The busy triggers list generated for reports offers additional information about each trigger.
Configuration of this widget includes the following options (aside from the general settings of a widget):
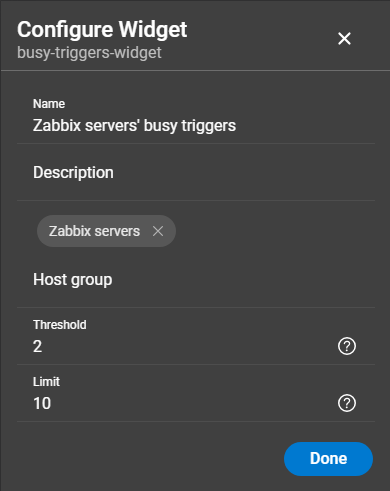
- Host group: Include triggers from hosts in this group in the report.
- Threshold: Activation threshold for trigger events. Triggers exceeding this number are included in the report.
- Limit: Maximum amount of triggers included in the report.
Render examples
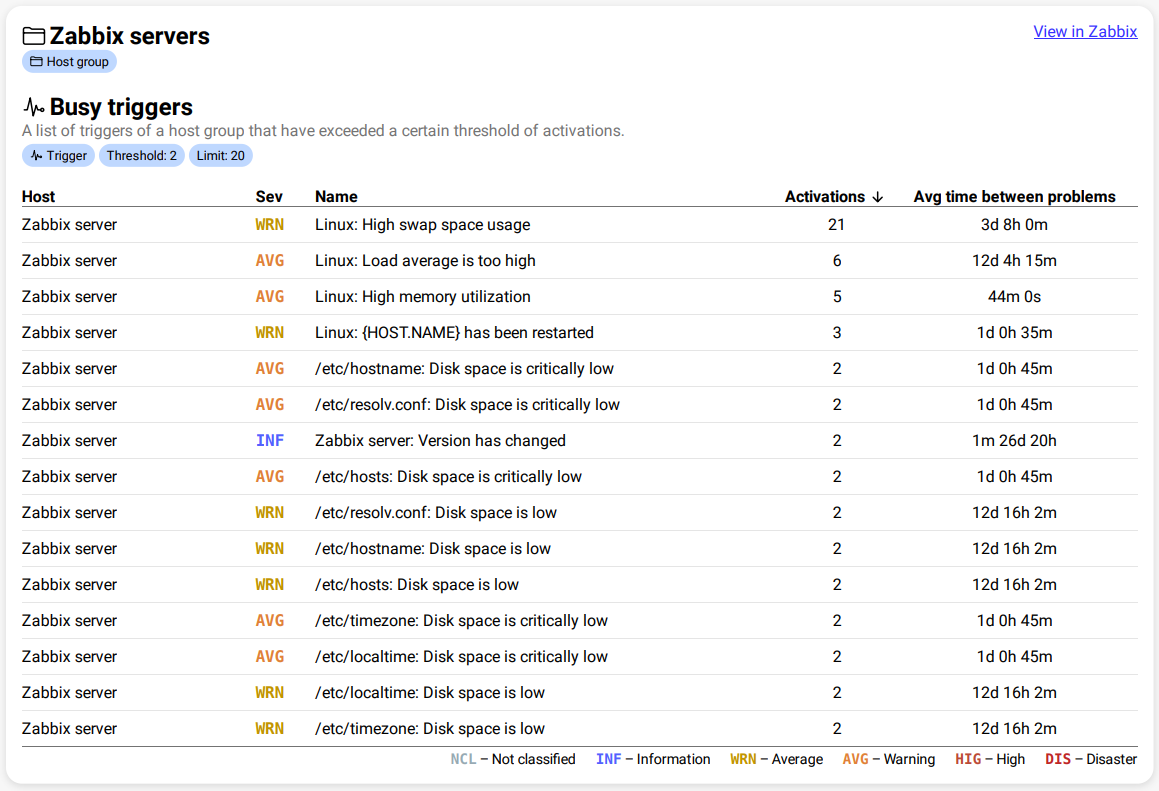
- Host: The source host of the trigger.
- Sev: The severity associated with the trigger.
- Name: The name of the trigger.
- Activations: The amount of activations within the reporting period (metric which the list is sorted by, in descending order).
- Avg time between problems: The average time between problems generated by the trigger within the reporting period.
{
	"name": "busy-triggers-widget",
	"displayName": "Busy triggers of Zabbix",
	"description": "",
	"error": "",
	"config": {
		"host_groups": [
			{
				"id": 4,
				"name": "Zabbix"
			}
		],
		"limit": 15,
		"threshold": 2
	},
	"hostgroups": [
		{
			"hostgroup": {
				"flags": 0,
				"groupid": 4,
				"name": "Zabbix",
				"uuid": "d1ddc1b94be1aeaddf"
			},
			"triggers": [
				{
					"trigger": {
						"comments": "The load average per CPU is too high. The system may be slow to respond.",
						"correlation_mode": 0,
						"description": "Load average is too high",
						"event_name": "Load average is too high (per CPU load over {$LOAD_AVG_PER_CPU.MAX.WARN} for 5m)",
						"expression": "{262458}/{262459}\u003e{$LOAD_AVG_PER_CPU.MAX.WARN}\r\nand {262460}\u003e0\r\nand {262461}\u003e0",
						"flags": 0,
						"groups": [
							{
								"flags": 0,
								"groupid": 4,
								"name": "Zabbix",
								"uuid": "d1ddc1b1c3e1aeaddf"
							},
							{
								"flags": 0,
								"groupid": 78,
								"name": "IntelliTrend",
								"uuid": "397e56b2f5088904a9930"
							}
						],
						"hosts": [
							{
								"flags": 0,
								"host": "monitoring",
								"hostid": 1084,
								"inventory_mode": -1,
								"ipmi_authtype": -1,
								"ipmi_privilege": 2,
								"maintenance_from": 0,
								"maintenance_status": 0,
								"maintenance_type": 0,
								"name": "Monitoring Server IntelliMon",
								"status": 0,
								"tls_accept": 1,
								"tls_connect": 1
							}
						],
						"lastchange": 1744746444,
						"manual_close": 0,
						"opdata": "Load averages(1m 5m 15m): ({ITEM.LASTVALUE1} {ITEM.LASTVALUE3} {ITEM.LASTVALUE4}), # of CPUs: {ITEM.LASTVALUE2}",
						"priority": 3,
						"recovery_mode": 0,
						"state": 0,
						"status": 0,
						"templateid": 83341,
						"triggerid": 102354,
						"type": 0,
						"value": 0,
						"hostGroups": [
							{
								"flags": 0,
								"groupid": 4,
								"name": "Zabbix",
								"uuid": "d1ddc1b1c3c294be1aeaddf"
							},
							{
								"flags": 0,
								"groupid": 78,
								"name": "IntelliTrend",
								"uuid": "397e56b2f95088904a9930"
							}
						]
					},
					"activations": 15,
					"averageTimeBetweenProblems": 37028.5
				}
			]
		}
	]
}