Alert log
Retrieves alert actions from a host group and displays them in a chart, categorized by user and alert type.
The alert log chart provides an overview of the number of alerts per user, broken down by media type. By including history data when configuring the widget, a specific number of issues is displayed, each with its own list of alert actions. Every alert contains further details about the recipient, the media type and if and when the alert was forwarded.
The configuration of an alert log widget includes the following options (aside from the general settings of a widget):
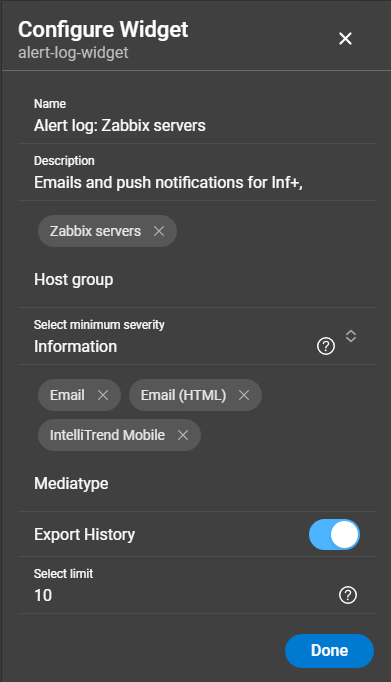
- Host group: Host group to include alert logs from its hosts in the report.
- Select minimum severity: Include alerts caused by a trigger with this severity or higher.
- Mediatype: Media types to include in the report.
- Export history: Whether the widget generates lists for the generated events. These lists show which user was notified via which media type.
- Select limit: Amount of log entries included in the report. Alert events are selected from newest to oldest.
Render examples
Alert log chart

Alert log history
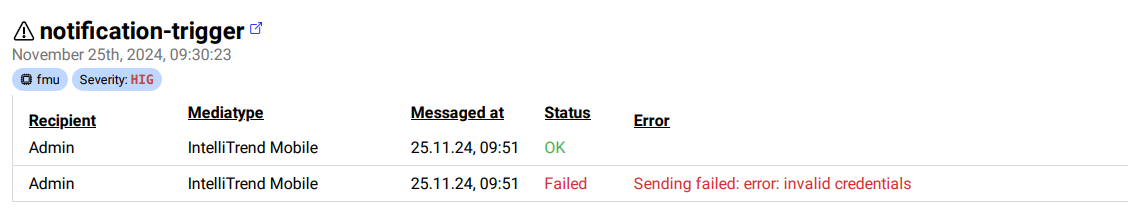
- The symbol next to the problem name opens the event details in Zabbix.
- The badges indicate the source host and the severity of the problem.
{
	"name": "alert-log-widget",
	"displayName": "Alert logs for Zabbix servers",
	"description": "Inf+",
	"error": "",
	"config": {
		"host_groups": [
			{
				"id": 4,
				"name": "Zabbix servers"
			}
		],
		"min_severity": 2,
		"mediatypes": [
			{
				"id": 1,
				"name": "Email"
			},
			{
				"id": 4,
				"name": "Email (HTML)"
			},
			{
				"id": 34,
				"name": "IntelliTrend Mobile"
			}
		],
		"limit": 10,
		"export_history": true
	},
	"hostgroupAlerts": [
		{
			"hostgroup": {
				"flags": 0,
				"groupid": 4,
				"name": "Zabbix servers",
				"uuid": "6f6799aa69e844b4b3918f779f2abf08"
			},
			"problems": [
				{
					"event": {
						"acknowledged": 0,
						"clock": 1741039204,
						"eventid": 1336750,
						"hosts": [
							{
								"flags": 0,
								"host": "zabbix-agent",
								"hostid": 10084,
								"inventory_mode": 0,
								"ipmi_authtype": -1,
								"ipmi_privilege": 2,
								"maintenance_from": 0,
								"maintenance_status": 0,
								"maintenance_type": 0,
								"name": "Zabbix server",
								"status": 0,
								"tls_accept": 1,
								"tls_connect": 1
							}
						],
						"name": "High memory utilization (\u003e90% for 5m)",
						"ns": 608291678,
						"object": 0,
						"objectid": 22390,
						"r_eventid": 1337013,
						"severity": 3,
						"source": 0,
						"suppressed": 0,
						"value": 1
					},
					"alert": [
						{
							"actionid": 3,
							"alertid": 3922565,
							"alerttype": 0,
							"clock": 1741047064,
							"error": "Sending failed: SyntaxError: invalid json (at offset 1)",
							"esc_step": 1,
							"eventid": 1337013,
							"mediatypeid": 34,
							"mediatypes": [
								{
									"attempt_interval": "2s",
									"maxattempts": 1,
									"maxsessions": 0,
									"mediatypeid": 34,
									"name": "IntelliTrend Mobile",
									"process_tags": 0,
									"script": "...",
									"show_event_menu": 0,
									"smtp_authentication": 0,
									"smtp_port": 25,
									"smtp_security": 0,
									"smtp_verify_host": 0,
									"smtp_verify_peer": 0,
									"status": 0,
									"timeout": "30s",
									"type": 4
								}
							],
							"message": "Trigger: High memory utilization (\u003e90% for 5m)\r\nTrigger status: OK\r\nTrigger severity: Average\r\nTime: 00:11:04\r\n\r\nItem values:\r\n1. Memory utilization (Zabbix server:vm.memory.utilization): 89.23 %\r\n\r\nNote:\r\nThe problem has been fixed. The status has changed from \"Average\" to OK.  \r\n\r\nUnder \"Acknowledgements\" you can view the confirmation from the relevant employee. If no data is displayed here, this problem has not been acknowledged / viewed by any employee.",
							"p_eventid": 1336750,
							"retries": 1,
							"sendto": "...",
							"status": 2,
							"subject": "[Recovered]: High memory utilization (\u003e90% for 5m)",
							"userid": 160,
							"users": [
								{
									"attempt_clock": 1707904133,
									"attempt_failed": 0,
									"attempt_ip": "172.20.20.221",
									"autologin": 0,
									"autologout": "0",
									"lang": "default",
									"name": "E.",
									"refresh": "30s",
									"roleid": 3,
									"rows_per_page": 50,
									"surname": "G.",
									"theme": "default",
									"timezone": "default",
									"userid": 160,
									"username": "Admin"
								}
							]
						}
					]
				}
			]
		}
	],
	"userAlerts": [
		{
			"user": {
				"attempt_clock": 1741100589,
				"attempt_failed": 0,
				"attempt_ip": "172.18.0.11",
				"autologin": 1,
				"autologout": "0",
				"lang": "default",
				"name": "Zabbix",
				"refresh": "0",
				"roleid": 3,
				"rows_per_page": 50,
				"surname": "Administrator",
				"theme": "dark-theme",
				"timezone": "default",
				"userid": 1,
				"username": "Admin"
			},
			"totalAlerts": 52,
			"alertsByMediatype": {
				"IntelliTrend Mobile": [
					{
						"actionid": 3,
						"alertid": 3913563,
						"alerttype": 0,
						"clock": 1741016044,
						"error": "Sending failed: SyntaxError: invalid json (at offset 1)",
						"esc_step": 1,
						"eventid": 1335954,
						"hosts": [
							{
								"flags": 0,
								"host": "zabbix-agent",
								"hostid": 10084,
								"inventory_mode": 0,
								"ipmi_authtype": -1,
								"ipmi_privilege": 2,
								"maintenance_from": 0,
								"maintenance_status": 0,
								"maintenance_type": 0,
								"name": "Zabbix server",
								"status": 0,
								"tls_accept": 1,
								"tls_connect": 1
							}
						],
						"mediatypeid": 34,
						"mediatypes": [
							{
								"attempt_interval": "2s",
								"maxattempts": 1,
								"maxsessions": 0,
								"mediatypeid": 34,
								"name": "IntelliTrend Mobile",
								"process_tags": 0,
								"script": "...",
								"show_event_menu": 0,
								"smtp_authentication": 0,
								"smtp_port": 25,
								"smtp_security": 0,
								"smtp_verify_host": 0,
								"smtp_verify_peer": 0,
								"status": 0,
								"timeout": "30s",
								"type": 4
							}
						],
						"message": "Trigger: High memory utilization (\u003e90% for 5m)\r\nTrigger status: PROBLEM\r\nTrigger severity: Average\r\nTime: 15:34:04\r\n\r\nItem values:\r\n1. Memory utilization (Zabbix server:vm.memory.utilization): 90.4 %\r\n\r\nDescription:\r\nThe system is running out of free memory.",
						"retries": 1,
						"sendto": "...",
						"status": 2,
						"subject": "Average: PROBLEM: High memory utilization (\u003e90% for 5m)",
						"userid": 1,
						"users": [
							{
								"attempt_clock": 1741100589,
								"attempt_failed": 0,
								"attempt_ip": "172.18.0.11",
								"autologin": 1,
								"autologout": "0",
								"lang": "default",
								"name": "Zabbix",
								"refresh": "0",
								"roleid": 3,
								"rows_per_page": 50,
								"surname": "Administrator",
								"theme": "dark-theme",
								"timezone": "default",
								"userid": 1,
								"username": "Admin"
							}
						]
					}
				]
			}
		}
	]
}