Alert log
Retrieves alert actions from a host group and displays them in a chart, categorized by user and alert type.
Users with the necessary permissions can access all widget types for creating reports. However, the data retrieved by each widget from the Zabbix server depends on the Zabbix permissions of the service user.
While creating and configuring a report, widgets can be added and configured. Each report has a dedicated section called Widgets, consisting of a button to add new widgets and a list of existing widgets. The list can be used to rearrange the widgets, or access the configuration page of a widget.
Widgets can be added by clicking the plus button, which will open a list of available widgets:
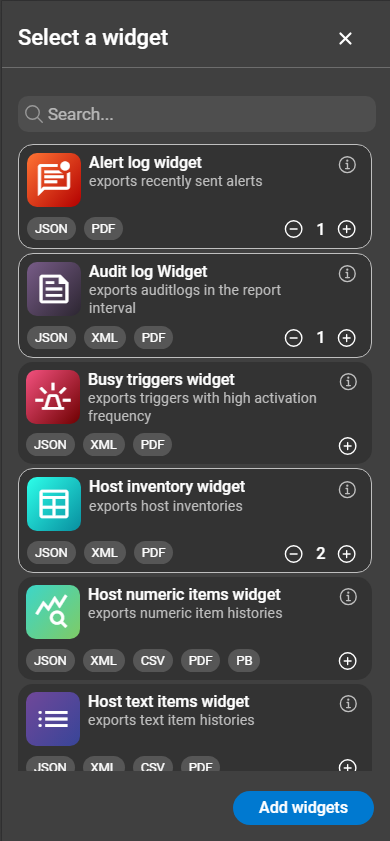
The plus/minus icons of a widget are used to specify how many widgets of this type should be added to the list. The Information icon opens the documentation page for this widget. After selecting the desired widgets, click on Add widgets. The selected widgets appear in the list for further configuration. To configure a widget, click the entry in the list.
Widgets can be configured when they are added to a report, or via their configuration page. Click on the widget in the list to open its configuration. Configuration options may vary depending on the widget type.

All widgets have three general settings in common:
In addition to these general settings, each widget is configured depending on the type. Available widgets are listed below, with further information on the configuration of each widget on the corresponding page.
After completing the configuration, click Done.
Retrieves alert actions from a host group and displays them in a chart, categorized by user and alert type.
The widget retrieves the audit log data from a Zabbix server and presents it in a list.
Returns a list of triggers from a host group, that exceeded a specified amount of activations.
This widget retrieves the hosts inventory data from the Zabbix server. Presented in PDF-reports as a list.
This widget retrieves numerical item data of a host from a Zabbix server displays it as a graph, alongside further information like the host’s id and interfaces.
Fetches text item data of a host from a the Zabbix server and is displayed as a list in the PDF-rendered report.
This widget retrieves data on long-standing problems of a host group. A long-standing problem is a problem that is open for a certain period of time, but at least one day.
This widget doesn’t retrieve data, but can incorporate a markdown section into the report.
The MTTI widget retrieves interaction data of triggers from a host group and presents them in a list.
The MTTR widget retrieves recovery data of triggers from a host group and presents them in a list.
Fetches problem data of a host groups and can be further narrowed down by specifying hosts. For example the number of open and closed problems, severity, etc. of a host group.
Fetches data from services and service level agreements (SLAs) of a Zabbix server.
The trigger state widget retrieves trigger data from a host group based on the time a trigger stayed in the problem state.