Reports
PDF, JSON, CSV, and XML.Overview
Prisma reports are structured documents that collect, process, and present data from the Zabbix server in a meaningful way, helping to analyze and interpret key information.
Reports are built using widgets, are periodically generated and automatically sent to all subscribers via their configured media types.
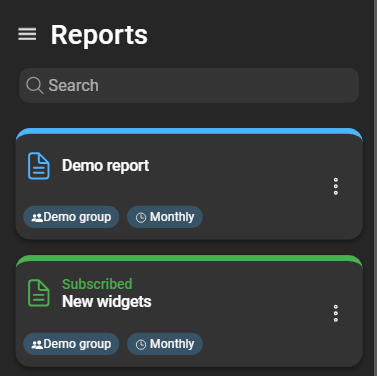
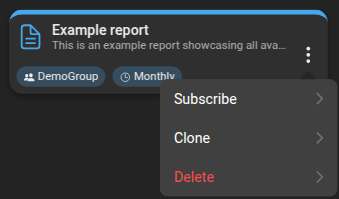
A card displays the selected Prisma user group for the report and the configured schedule. A report card can be in two states:
- Blue header and icons: User is not subscribed to this report.
- Green header and icons: User is subscribed to this report.
Create a new report
To create a new report, log in as (or impersonate) a Prisma user with the required permissions. Navigate to Reporting > Reports and click the blue plus button in the bottom right corner:
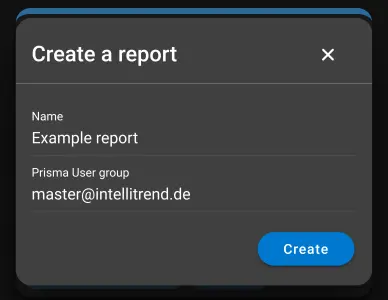
- Name: Name for the report.
- Prisma user group: Prisma user group defining the accessible data from Zabbix.
Click Create to finish.
Report configuration
General
In the General section, configure basic attributes such as Name, Short Description, and Long Description for the report.
The Long Description is intended for in-depth information or explanations about the report. It is included only in the rendered document, for example on the cover page of the PDF report.
Scheduling
In the Scheduling section, configure the Schedule mode of the report. The mode defines the automatic rendering interval. For a Daily schedule, the exact time can additionally be specified. Weekly reports are rendered at 00:00 (server time) on the selected weekday. Other scheduling modes are rendered as follows:
- Daily: At the specified time.
- Weekly: At 00:00 (server time) on the selected weekday.
- Hourly: At minute 0 of every hour.
- Monthly: At 00:00 on the first day of a month.
- Quarterly: At 00:00 on the first day of a quarter.
- Yearly: At 00:00 on the first day of a year.
PDF rendering options
Options available specifically for PDF reports:
- Include table of contents page: If disabled, the table of contents is not rendered.
- Problems limit: Maximum number of problems rendered in lists. Does not affect graphs or calculations.
- Text items limit: Maximum number of text item values rendered in lists. Does not affect calculated values.
Widgets
In the Widgets section, create, configure, delete, and reorder widgets. Widgets define the structure and data of a report. At least one widget must be added to render a report.
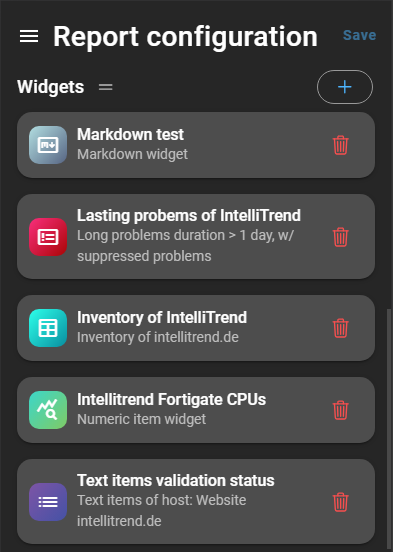
More information about available widgets and the data they can retrieve is provided in the Widgets chapter.
Reports
In the Reports section, view, delete, and download rendered reports.
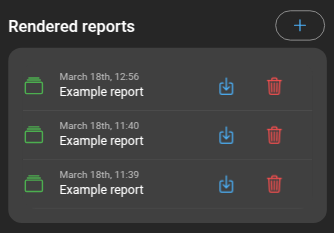
Reports can also be manually rendered to generate a new report without waiting for the next scheduled run.
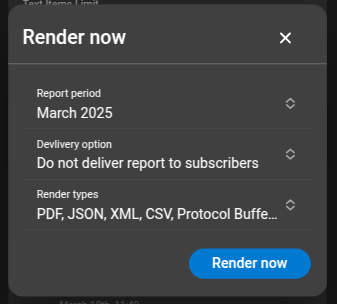
Click the + button above the list to open the Render now dialog. Options include:
-
Report period: Time frame for the report.
-
Delivery option:
- Deliver only to me: Delivered only to the current user. Requires subscription.
- Deliver to all subscribers: Delivered to all subscribers.
- Do not deliver report to subscribers: Report is not delivered, only available for download.
-
Render types: When choosing Do not deliver report to subscribers, select which render types to generate. Otherwise, all render types selected in the subscription are used.
Click Render now to create a new report. For more details, navigate to the Report details page by clicking the report.
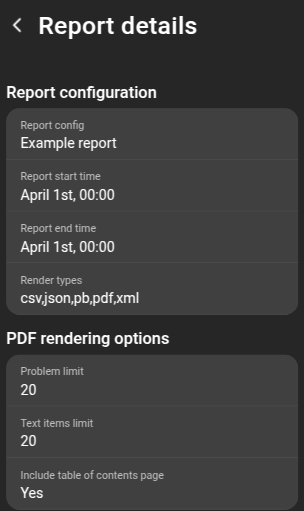
The Report configuration shows the report config name, report start time, report end time, and render types.
The PDF rendering options section displays the configured problem limit, text item limit, and table of contents option.
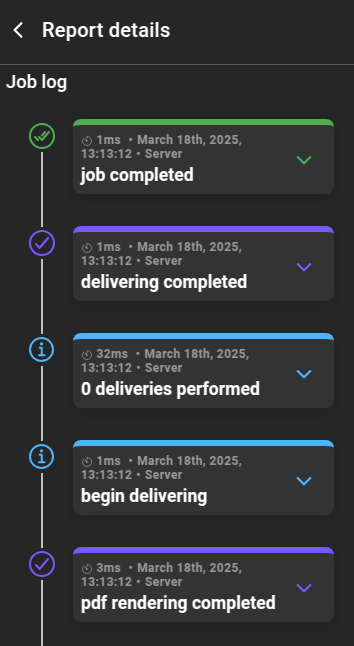
Below is the event log of the report job, including warnings or errors:
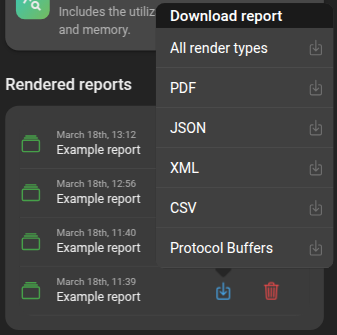
Once rendered, reports can be downloaded at any time from the report list:
JSON-Transformers
In the JSON-Transformers section, view, create, configure, delete, and reorder transformers.
Learn more in the JSON-Transformers chapter.
Clone reports
Reports can also be created by cloning. To clone a report, open the context menu of the report and select Clone.
The cloned report requires a name. Click Clone to finish. The new report appears in the list.
Delete reports
To delete a report, open the context menu and select Delete. Prisma prompts for confirmation before proceeding. Once confirmed, the report is removed from the list.