Datasets
To access and create dataset configs, navigate to AI > Dataset.
Creating dataset configs
To create a dataset config, click the blue plus button. This opens a form:
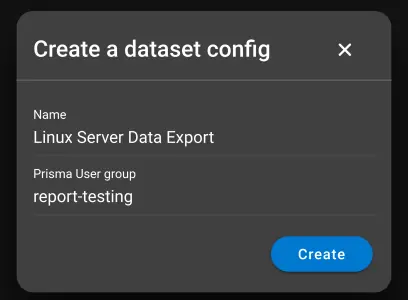
- Name: Name for the dataset config.
- Prisma user group: Select a Prisma user group. Similar to the reporting feature, a user group is required so the service user can provide access to data on the Zabbix server.
Click Create to continue.
Configuring datasets
To configure a dataset, click the dataset entry. This opens the dataset config details:
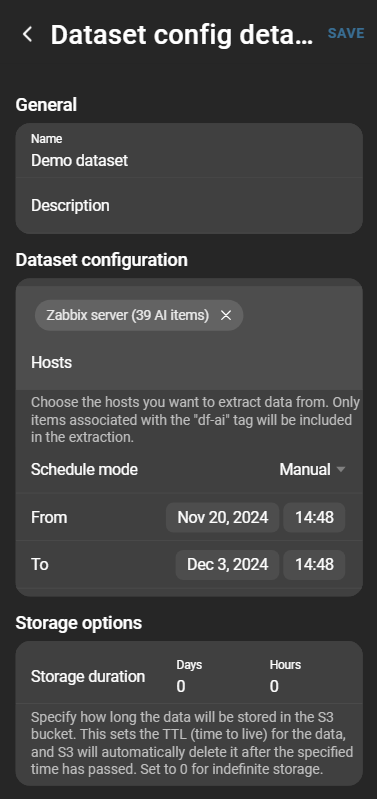
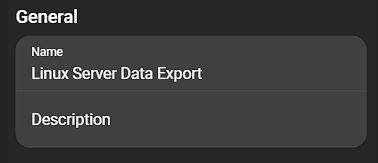
General
Change the dataset name or add a description.
Dataset configuration
This configuration is split into two categories:
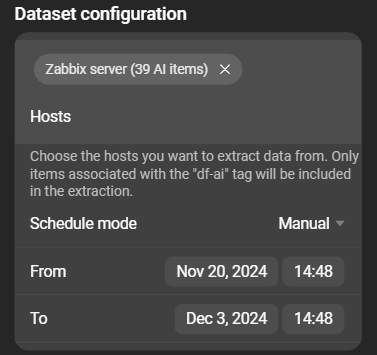
- Hosts: Hosts from which the data is retrieved. Each host has an AI item count in parentheses next to its name.
- Schedule: The schedule (interval) that determines the time span from which data for the dataset is processed and generated.
Hosts
When selecting one or more hosts, Prisma extracts the item histories from the host on the Zabbix server.
Prisma only extracts histories from items tagged with df-ai. This tag must be set manually for each item to be included in the dataset.

df-aiSchedule
Two possible options are available for scheduling:
- Preset: Datasets are generated in a defined interval. Data recorded within the interval is included.
- Manual: Start date, end date and time are set manually. Only one dataset is created, using data from that period.
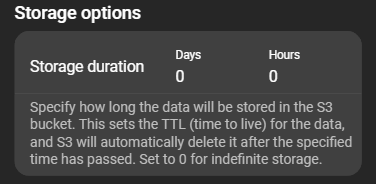
Storage options
Storage options can be used to organize datasets. A time period in days and/or hours can define how long a dataset is kept. When older than the defined time, the dataset is deleted.
Datasets
A list of all created datasets and the option to create a dataset on demand.
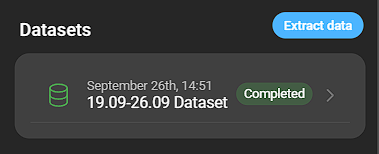
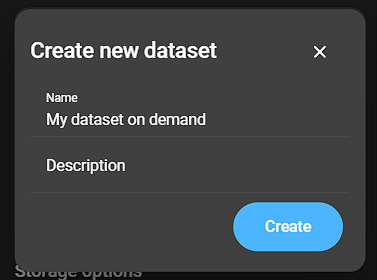
Create a dataset on demand by clicking Extract data. This opens a modal to provide a name and description. Click Create to finish.
Each dataset can be inspected further by clicking its entry. This opens the dataset details.
Dataset details
To inspect a dataset, navigate to AI > Dataset. Select the config which contains the dataset. Created datasets are listed at the bottom of the page. Click the dataset to open its details.
Extraction progress
While data is still being extracted, progress can be followed in real time in the job log.
Job log
The job log shows each job carried out to create the dataset. Each step can be expanded for more details.
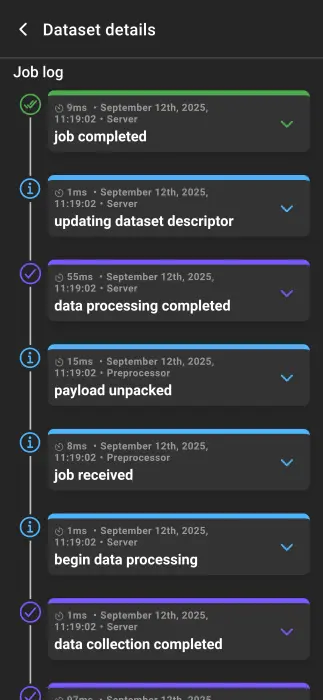
- Processing time: Duration of the step.
- Date and time: When the step was processed.
- Type: Type of event.
- Event: Event name.
- Microservice: Microservice responsible for the event.
- Full event: Full event stack trace.
Finished extracting
After extraction is complete, two additional sections are displayed.
General
This section contains basic information about the dataset:
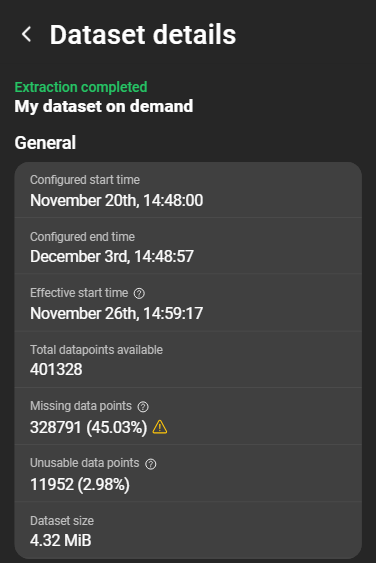
- Configured start time: Configured extraction start.
- Configured end time: Configured extraction end.
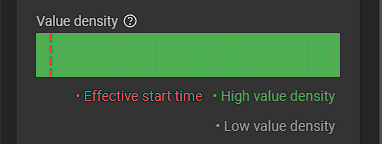
- Effective start time: First moment when data is effectively usable. Each item must have at least one value before the dataset becomes visible. Values existing before another series begins cannot be used.
- Total datapoints available: Number of datapoints received from Zabbix.
- Missing datapoints: Datapoints expected but missing in the time series.
- Unusable datapoints: Datapoints collected at times when not every item has had values yet and are thus discarded from the dataset.
- Dataset size: Size of the dataset.
Dataset items
Detailed information about each extracted item:
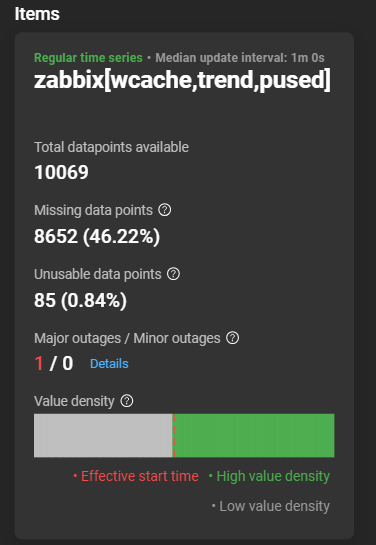
Each card shows information about the time series and item name.
Two time series states exist: Regular and Irregular. A regular time series has a defined update interval. Expected, but missing data points are displayed as such. In an irregular time series, missing points cannot be determined.
- Total datapoints available: Number of datapoints received from Zabbix.
- Missing datapoints: Number of expected datapoints missing. Only for regular time series.
- Unusable datapoints: Discarded datapoints collected when not yet available for other items.
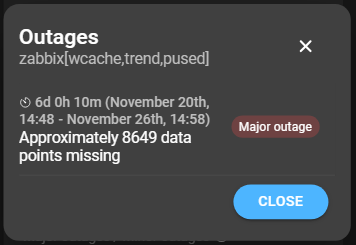
- Major/Minor outages: Amount of major and minor outages. Outages occur when expected points are missing in a regular series. If missing data exceeds 5% of the total, it is considered a major outage. A Details button provides further information.
- Value density: Measures the concentration of data points in the time series. Higher density indicates more points. Also indicates the effective start time, when each item had at least one value.